All Posts

Small data is akin to algebra; big data is like calculus.

Last week I received a message from SAS Technical Support saying that a customer's IML program was running slowly. Could I look at it to see whether it could be improved? What I discovered is a good reminder about the importance of vectorizing user-defined modules. The program in this blog
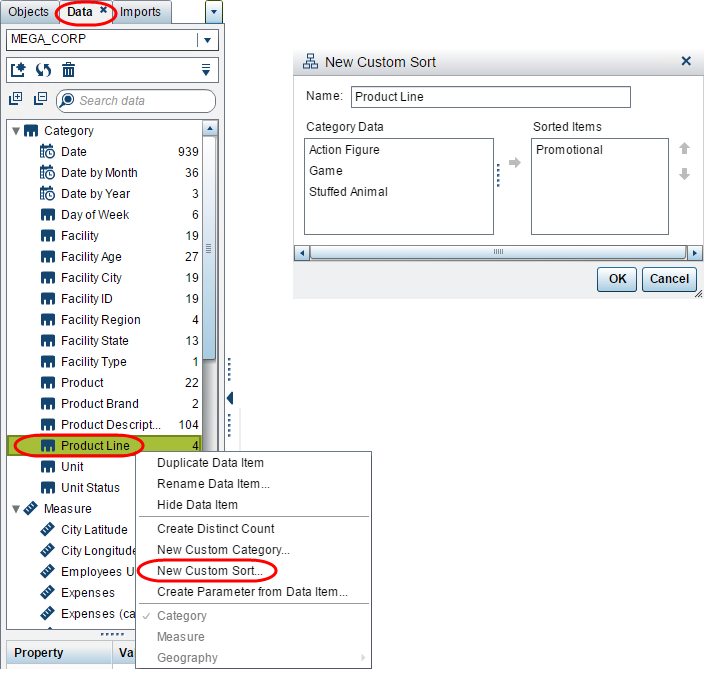

Does your week start on Sunday or Monday? Do you have a promotional product you would like to see at the top of your list? Do you have a particular order in which you like to view your regions? Custom sorting is now possible with SAS Visual Analytics 7.1. The

‘Big Data’ y ‘Analytics’ son las palabras de moda en este momento, pero más allá de eso, conforman el conjunto de habilidades del futuro. Desde la lucha contra la delincuencia y el crimen hasta la creación de estrategias ganadoras para un equipo de béisbol, la analítica ha sido parte de la


My Performance Validation team in SAS R&D is constantly working with our partners to test how their storage arrays work with SAS. In late 2014, we finalized several papers that discuss how a mixed analytics workload performs on several storage arrays. While doing this testing, we also listed lessons-learned in

In the movie Big, a 12-year-old boy, after being embarrassed in front of an older girl he was trying to impress by being told he was too short for a carnival ride, puts a coin into an antique arcade fortune teller machine called Zoltar Speaks, makes a wish to be big,

For years, saturated fat has been blamed for high cholesterol levels and heart attacks. This overemphasis on reducing fat intake led many people to start substituting high carbohydrate, high sugar, processed foods for fats - bye, bye eggs, hello fat-free cookies!
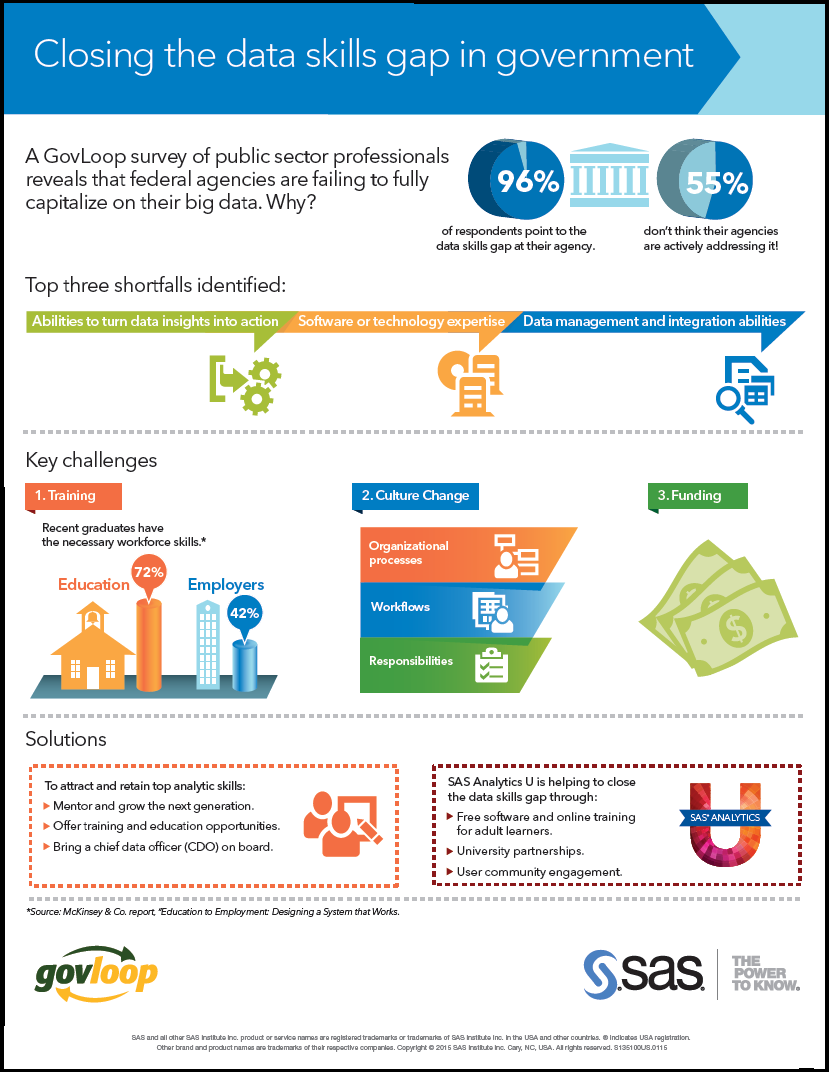

Despite an increase in the availability of data in the federal government over the past few years, data and analytics could be doing even more for federal agencies. A strategic approach to managing and analyzing the data is needed. And, like many technology challenges – that’s a people problem. A


I’m not a seasoned business traveler so I generally plan to arrive extra early and leave a little late to avoid any last-minute stress. The problem with all that stress-avoidance is that I often have extra time on my hands and am stuck with finding ways to entertain myself. What
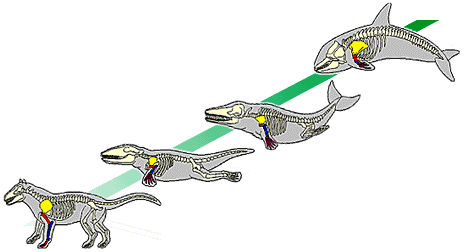

"You show me a successful complex system, and I will show you a system that has evolved through trial and error." ~ Tim Harford TED Talk link: http://www.ted.com/talks/tim_harford Karl Marx died thinking that the first communist revolution would occur in Great Britain, driven by the long hours and unsafe
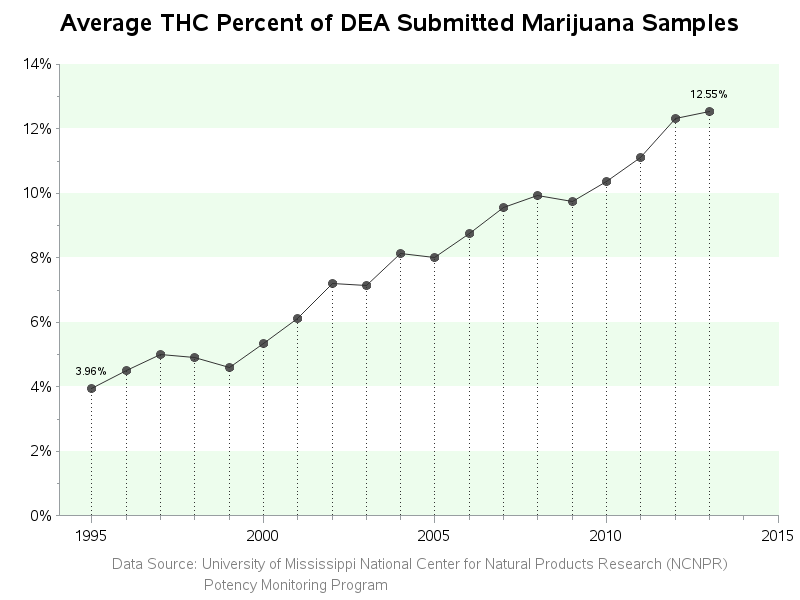

After the legalization of recreational marijuana use in Colorado in 2012, it has been a much more frequent news topic than before - even from a data analysis perspective... I was recently looking for 'interesting' data to analyze with SAS, and I noticed some articles about the increasing potency of marijuana in
SAS procedures usually handle missing values automatically. Univariate procedures such as PROC MEANS automatically delete missing values when computing basic descriptive statistics. Many multivariate procedures such as PROC REG delete an entire observation if any variable in the analysis has a missing value. This is called listwise deletion or using
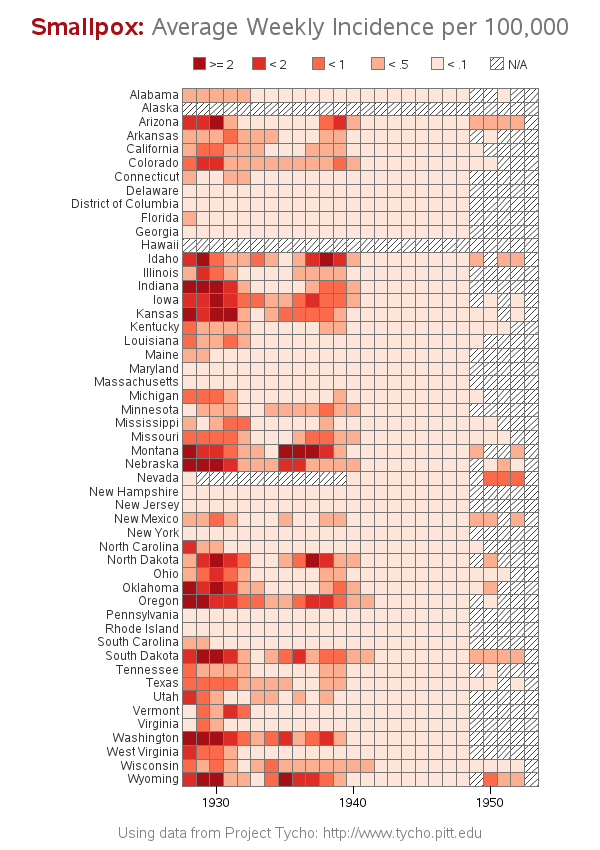
Smallpox was declared eradicated in 1979, after an extensive vaccination campaign in the 19th and 20th centuries. This blog post contains a visual analysis of the final years of this disease in the US ... In my previous blog post, I imitated and improved infectious disease graphs from a recent Wall
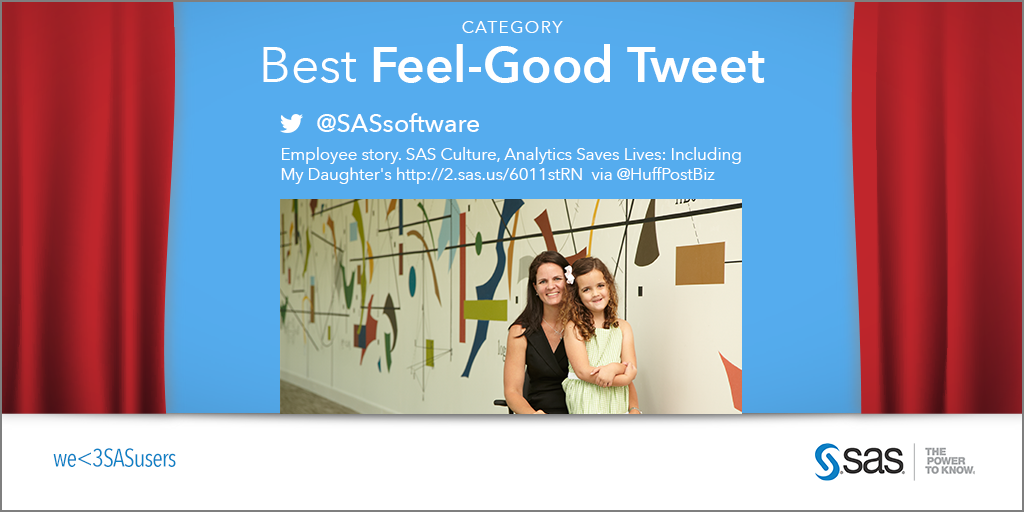

It's that time of year: Awards season. While we on the SAS Social Media Team will be happily following along this Sunday for the 87th Annual Academy Awards (via Twitter, naturally), we thought it only appropriate to use this as a time to celebrate our customers in social from 2014. From


Many states are starting to crack down on the serious abuses of government programs, cutting down on outright fraud as well as reducing abuses and errors. I wanted to highlight one of those, now that they've been on this path for a few years. North Carolina, where SAS is headquartered,