All Posts


Analytics as it pertains to the employees and the workforce is taking the industry by storm. Recently, I read an article in the Wall Street Journal about how companies are harnessing the power of analytics to help them identify staff who are likely to leave. In the past few weeks
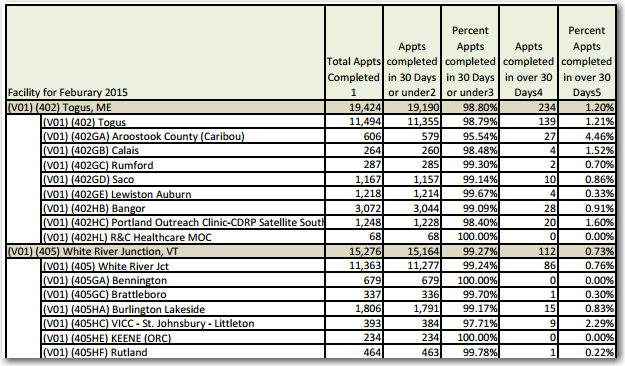

Data about the monthly wait times at VA facilities in the US are now available, but it's a bit overwhelming to try to analyze them in tabular form - plotting the data on a map made it a lot easier!... Here in the US, when our soldiers finish their commitment in
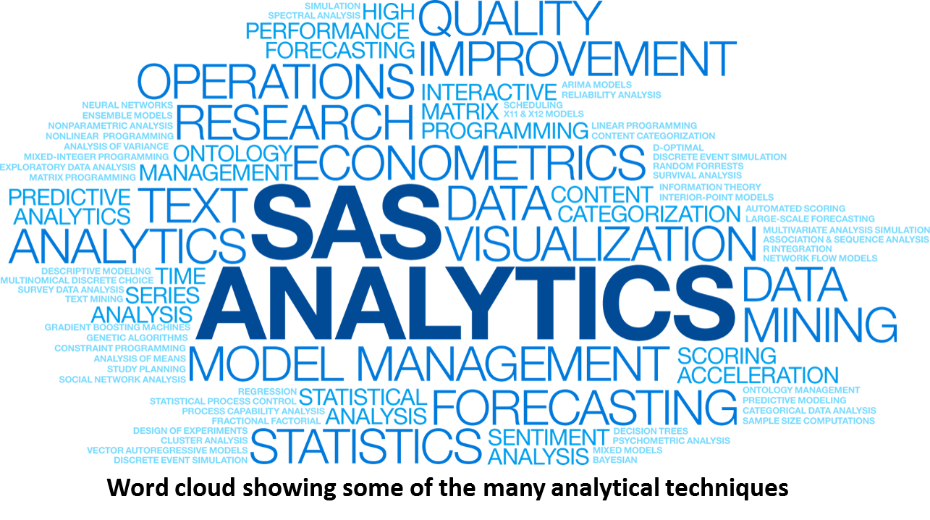

There is no doubt that analytics is an overused and often abused term. So what does really analytics means? In part 2 of a series of articles on the analytical lifecycle, this blog will highlight some of the common and emerging techniques used to analyze data and build predictive models
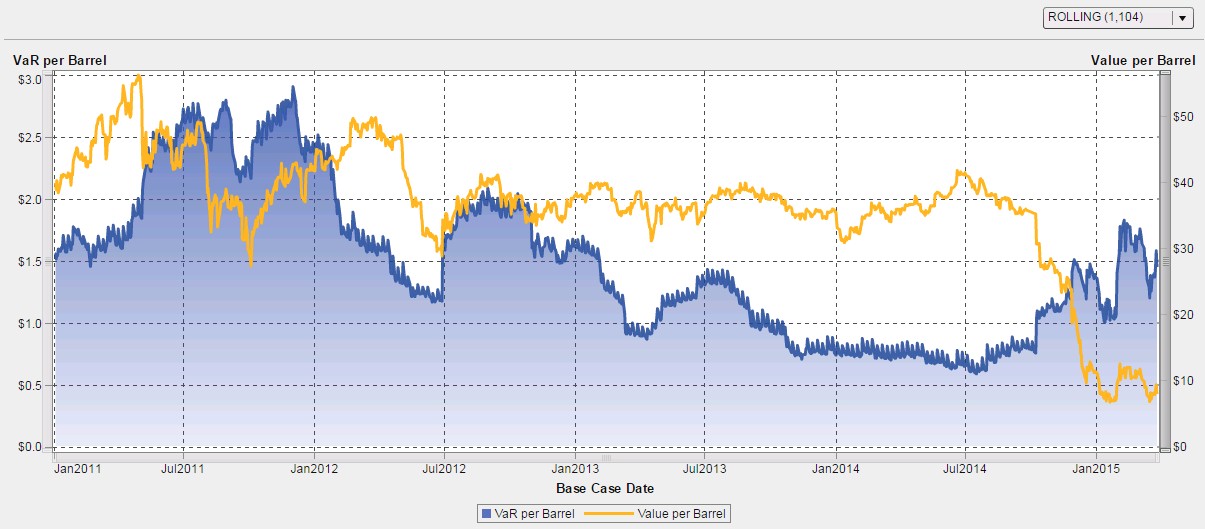

Oil is bouncing around the $50 range as the market adds and loses value with each new headline, from potential new Iranian exports after the nuclear talks to the slowest month of inventory builds at Cushing since Thanksgiving. The US rigcount is down nearly 23 percent year-over-year, but the rate


I watched with wonder as each of my daughters learned how to "tell time." Early in their primary school careers, they brought home worksheets that featured clock faces with big-hand/little-hand configurations that they had to decipher, and exercises that asked them to draw the hands as they should appear given


Many experienced and novice SAS programmers take advantage of the power of a “language within a language” offered by PROC SQL, SAS/IML and the SAS Macro Facility. But how many of you are aware of recently added languages and techniques? These newer tools are designed to help SAS programmers leverage

With so much information available about high-performance analytics, business intelligence and visual analytics, it can be difficult to know exactly where to begin, especially if you don’t have a team of statisticians standing by. I'm frequently asked by customers who hope to take advantage of analytics how to get started. How do
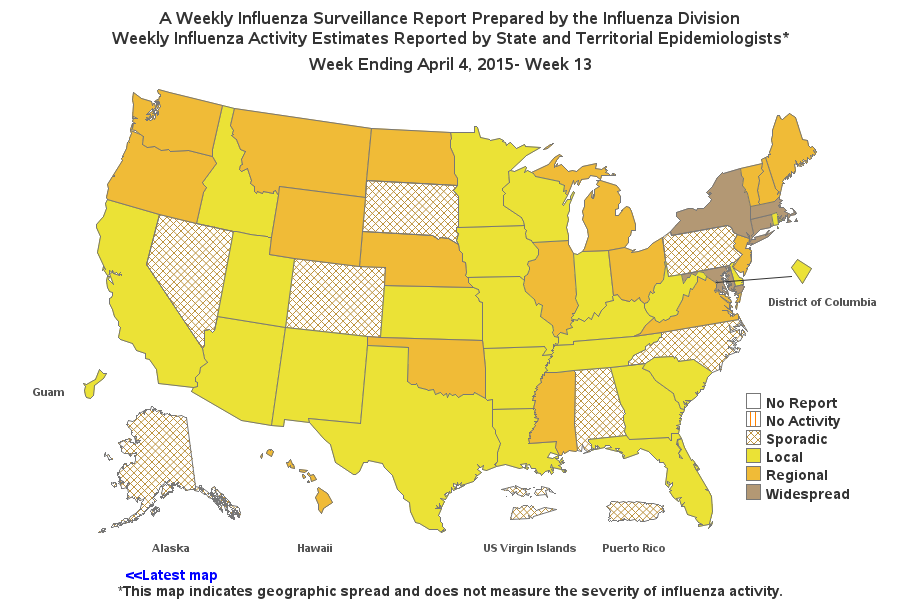
Has this year's flu been better or worse than you thought it would be? There are a lot of factors that help determine whether or not you're likely to get the flu. Is there a bad strain going around? Did the flu vaccine target the right strain? Did you get


If you are one of the thousands of SAS users soon to be in Dallas for SAS Global Forum, you've probably already used the online tools to help you view sessions related to your industry. It’s easy to do by filtering on your own particular industry, such as banking, or

In the last few days, I have heard the term “data lake” bandied about in various client conversations. As with all buzz-term simplifications, the concept of a “data lake” seems appealing, particularly when it is implied to mean “a framework enabling general data accessibility for enterprise information assets.” And of


Unplugging for a week: Crazy or possible?! How many of you have had that day, weekend or week when you ask yourself “what else can the kids do?” Not only for their sanity but for yours too! We all want the same things for our kids: to stay as active as


Estamos ante la era del Big Data y las modernas soluciones que existen actualmente en el mercado hacen cada vez más fácil manejar los grandes volúmenes de información. Sin embargo, vale la pena preguntarnos, ¿son necesarios tantos datos? En otras palabras, si su solución de analítica puede organizarlos, consolidarlos y

I press a button, a miracle machine churns through all the calculations in the world and the answer to the Ultimate Question of Life, the Universe, and Everything[1] is produced as a single number. Oh hang on, that’s 42. Alright, for our microcosm, let’s stick to the answer to my


After working as a flight attendant for more than 20 years, Lauren Guevara was ready for a new adventure. The inspiration for her journey came from an article she read in CNN’s Money magazine that highlighted the earning potential of a SAS Certification. Also having earned a Master of Science


This is a follow up to last week’s blog on understanding your customers’ perceptions of quality. As the world’s largest manufacturer of PCs and tablets, Lenovo is always looking for areas to reduce costs while increasing quality and customer satisfaction. Six months ago, Lenovo implemented the Lenovo Early Detection (LED) system