All Posts


Less than a year ago, the country’s attention was on Dallas after the first Ebola patient died. Not only is that where this project begins, but also where it was presented at SAS Global Forum in Dallas. Sharat Dwibhasi and his classmates Dheerj Jami and Shivkanth Lanka from Oklahoma State

@philsimon says that, yes, we can learn a great deal.


I was at a Saturday team-building workshop two weeks ago with folks from a non-profit I work with, and in a small group we were invited to write down 5 questions to ask each other. I received a total of 15 but only had to answer 2 (so it was


any factors go into your strategic global business decisions, from the physical placement of factories and distribution centers, to your choice of suppliers and partners, to your target markets and the business model itself. Businesses have a choice of fundamental global go-to-market investment strategies, from direct foreign investment on the one

I'm a huge Star Wars fan. I got chills when I saw the trailer for The Force Awakens! Last year for SAS Global Forum, I wrote a paper called Star Wars and the Art of Data Science. I explored the scripts from the original Star Wars trilogy (A New Hope,


If you’re one of the hundreds of SAS users registered for PharmaSUG, scheduled for May 17-20 in Orlando, you should give extending your stay some serious thought. In just a few hours, you can set yourself apart with a professional certification from SAS! SAS is offering something no theme park

Hadoop, in-memory analytics, the Internet of Things (IoT), machine learning, data visualization— topics that are dominating the analytics airwaves. SAS is innovating in all these areas, rapidly developing new products and functionality to meet the needs of today’s analytic environment. During this year’s Technology Connection session, SAS Global Forum 2015


I read an interesting article recently that suggested analyst and data scientist job positions may be on the way out. The author argued that analytics are being incorporated more and more heavily into operational systems, making “analytic capabilities” more readily accessible to business users without the involvement of a data scientist. Being a data

In April, the free trial of SAS Data Loader for Hadoop became available globally. Now, you can take a test drive of our new technology designed to increase the speed and ease of managing data within Hadoop. The downloads might take a while (after all, this is big data), but I think you’ll

Did you know that if you have set multiple titles in SAS, that there is an easy way to remove them? For example, suppose that you've written the following statements, which call the TITLE statement to set three titles: title "A Great Big Papa Title"; title2 "A Medium-sized Mama Title";

We’re celebrating the student in all of us and you’re invited. Email us a photo of yourself or your fav SAS user learning SAS. Send it to sastraining@sas.com. You can also Tweet us your best shot using #SASworldclass Our planet-friendly training is available worldwide, wherever you may be. Show us
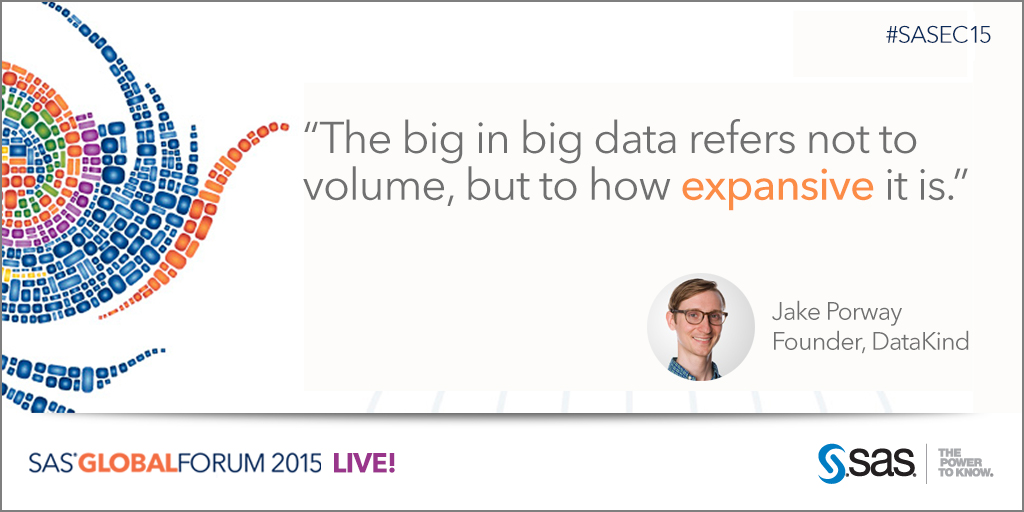

It’s an incredibly exciting time for data science. Just ask Jake Porway, former New York Times Data Scientist and now CEO of DataKind, who opened his April 28 SAS Global Forum keynote by asking busy conference goers to pause and reflect on the revolutionary times we are living in. “Cell phones


Data governance and data virtualization can become powerful allies. The word governance is not be understood here as a law but more as a support and vision for business analytics application. Our governance processes must become agile the same way our business is transforming. Data virtualization, being a very versatile


How many times have you had a need to convert between variable types such as converting character to numeric or numeric to character? For example, what if you have a character variable with numeric values but you need to perform some calculations? Or, if you have a numeric variable but
SAS Global Forum provides a perfect opportunity for SAS users group leaders from across the country to meet in-person to share best practices and new ideas. This year’s SAS users group leaders link-up event was led by Melissa Perez – the new users group programs manager at SAS. She talked