All Posts


A Vermont Department of Children Families (DCF) worker was murdered last month. The lead suspect is the mother of a child that was previously removed from her care and placed in foster care. This tragedy illustrates the challenges and risks that workers have in the field of serving at risk

Savannah plays host to the 23rd annual SouthEast SAS Users Group (SESUG) conference from Sept. 27 to Sept. 29. Over 300 attendees are expected to gather in this historic city. If you’re planning to attend, I’ve selected a few special features that I hope will help both new and returning attendees
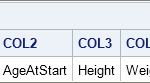

Dear Rick, I have a data set with 1,001 numerical variables. One variable is the response, the others are explanatory variable. How can I read the 1,000 explanatory variables into an IML matrix without typing every name? That's a good question. You need to be able to perform two sub-tasks:


Do you want to know what will happen in the future? To gain true predictive insight, skip the tea leaves and look toward your data. SAS instructor Jeff Thompson is a high-energy data mining expert who will be demonstrating how to gain predictive insight from your data in his new


It’s me again!! We're at the halfway point of meeting our Strata + Hadoop World dream team. So far, you’ve met machine learning guru Patrick Hall; data management expert Clark Bradley; and advanced analytics specialist Rachel Hawley. Next up … Dan Zaratsian! I met Dan a few years back while preparing for Analytics 2013


Many users of ODS Graphics will be excited to learn that, beginning with SAS® 9.4 TS1M3, SG procedures are able to recognize formatted values that contain Unicode values. One benefit of this is that it allows you to include, without using annotation, special symbols such as greater-than-or-equal-to signs or Greek


Even though the first papers in machine learning were in the 1950s, one could argue it goes back further to the work of Alan Turing and other early computer scientists. So why has this way of modeling seemingly become so popular now? Because data has become a commodity. Large amounts of many different
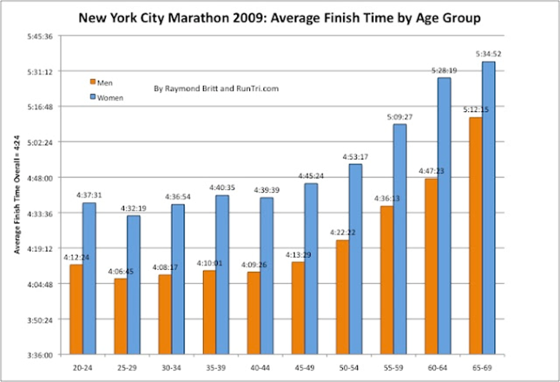

I read an article recently discussing how runners inevitably slow down with age, particularly after 50. Data from the New York Marathon and Boston Marathon back this up with generally flat average finishing times for ages 20-49 followed by a steady, almost exponential, increase after 50. I haven’t reached the
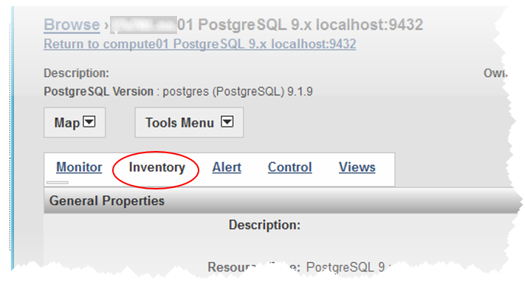

Many administrators are familiar with the well-known “WIP Data Server” component of a SAS installation–so this blog takes a closer look at it, and shows how easy it is to monitor how large the database is growing. This data server contains a SAS-critical database known as the SharedServices Database, which is
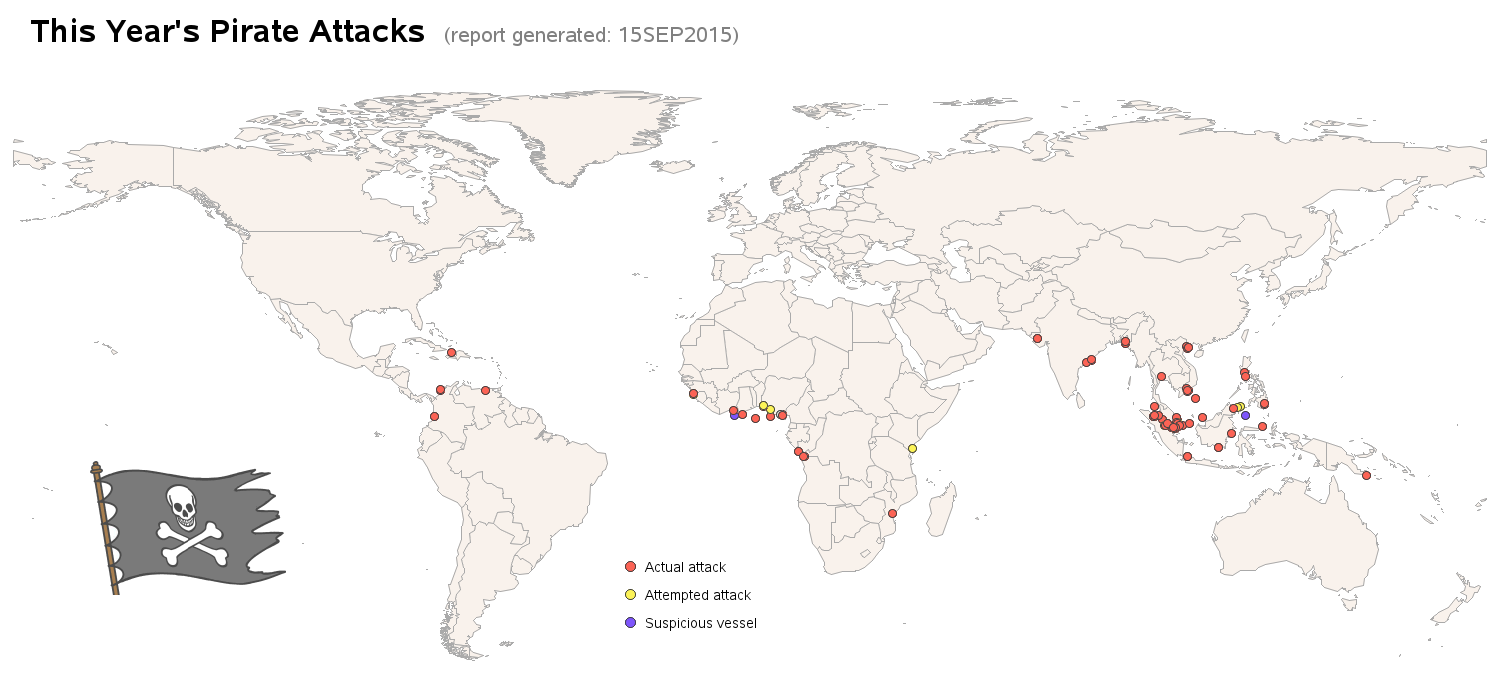

I just returned home from an expedition/adventure boat trip to Cuba, and Talk Like a Pirate day is coming up this Saturday - what a combination for an interesting blog! I hope you enjoy a few pictures, and a bit of data analysis on these topics! A couple of weeks ago,

In the UK, technology trends move a little slower than for our US counterparts. It was about 5 years ago when I first met a data leader at a conference on this side of the pond who was actively engaging in large scale big data projects. This wasn’t a presenter
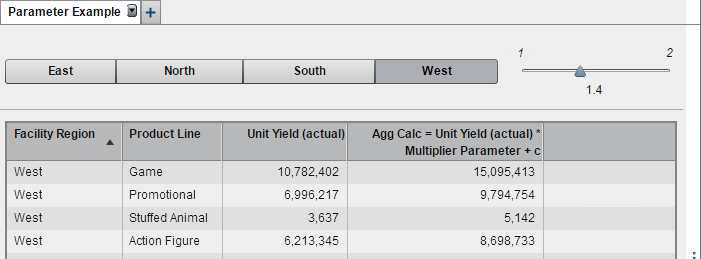

The SAS Visual Analytics 7.2 release introduced context sensitive URLs for VA reports which means we can now directly pass parameter values in the URLs! This opens the door and allows for greater flexibility when needing to use a URL to access a VA report. One use would be if

Among the tightly held cards, piles of chips and bright lights, there have been stories that have unfolded in Las Vegas that have been forever preserved in time, never seeing the light of day. But what if what happened in Vegas…could be shared with excitement with your friends and family?


Close your eyes…inhale deeply...now exhale fully. Absorb the smells, sounds, and sensations all around you. Connect with the ground under you; sense the sky above you. Now open your eyes and enjoy the fullness of the great outdoors! Oh wait! It is likely that you are inside while you are
Over 400 enthusiastic SAS users gathered in San Diego September 9-11, 2015 for the 23rd annual WUSS 2015 conference. In this “digital age,” where so much of our communication is virtual and social, it was a treat to get out and meet SAS users face-to-face. The two and a half-days were packed