All Posts


Healthcare IT News recently published an article on 18 health technologies poised for big growth, a list culled from a HIMSS database. The database is used to track an extensive list of technology products that have seen growth of 4-10 percent since 2010, but have not yet reached a 70


New York City is a pioneer in use of technology in many ways. For instance, the work of the Mayor’s Office of Data Analytics has been cited repeatedly as an example of smart city innovation. But the innovation doesn’t stop there. Two projects that used SAS data visualization and data

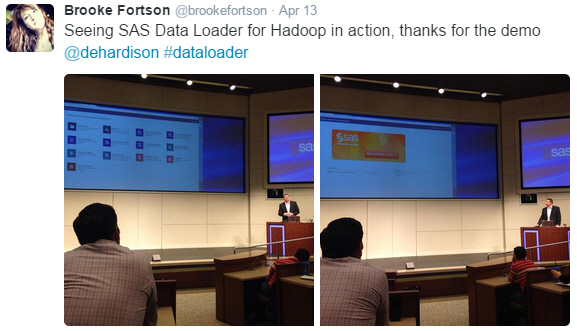
It’s been an amazing journey with Hadoop. As we discussed in an earlier blog, Hadoop is informing the basis of a comprehensive data enterprise platform that can power an ecosystem of analytic applications to uncover rich insights on large sets of data. With YARN (Yet Another Resource Negotiator) as its


In October I will be at the Analytics 2015 conference in Las Vegas. I’ve never been to Las Vegas before. People tell me that if you are better than average in forecasting where a small ball will end up after it’s been spinning for a while in a dish with


The need for fast and easy access to high-powered analytics has never been greater than it is today. Fortunately, cloud processing still holds the promise of making analytics more transparent and ubiquitous than ever before. Yet, a significant number of challenges still exist that prevent more widespread adoption of cloud

.@philsimon on the new role of IT.
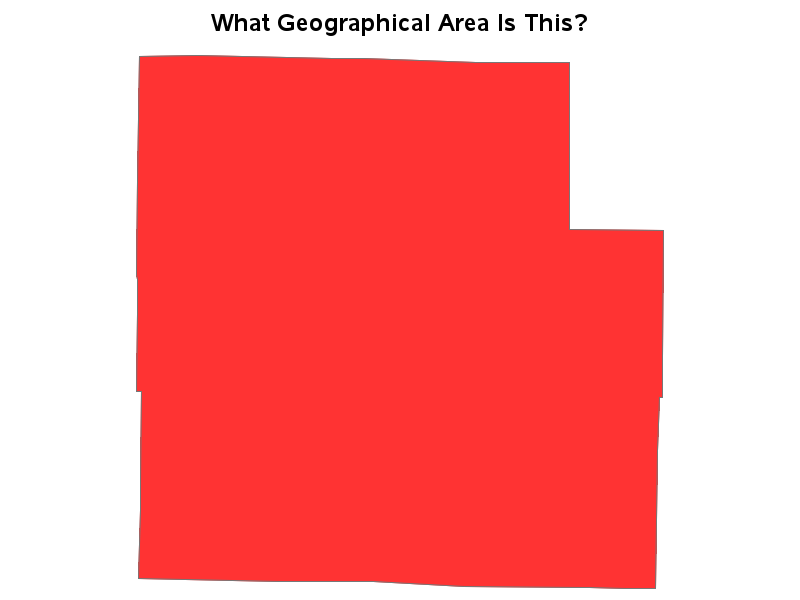

My blog posts focus on visual data analysis, and many of them use geographical maps. Therefore I hope you will have fun with a quick geography quiz, which I created using SAS/Graph ... And what, you might


September is Fruit and Veggie Month! What better way to celebrate than to learn more about what’s in season right now! Here in North Carolina it’s time for all the winter squash recipes to start floating around again! Winter squash is a great fiber rich, nutrient dense carbohydrate that’s loaded

A week from today, we'll be in New York City for Strata + Hadoop World, where we’ll kick things off at the Opening Reception. Be sure to stop by booth 543 to meet the team IRL (in real life)! They are excited about the event and eager to talk with attendees.


So you have an idea for a presentation for SAS Global Forum 2016. The idea isn’t earth shattering, but you did figure out how to do something cool in SAS. Still, you have a moment of pause. Questions abound. “Is it good enough? Should I submit it to the Call

It’s rather appropriate that the rock band Europe recorded the hit “The Final Countdown”, because today, September 22nd, represents 100 days until the much anticipated (and delayed) European insurance legislation Solvency II will come into effect on January 1st 2016. Designed to introduce a harmonized, EU-wide insurance regulation, Solvency II


At California Polytechnic State University, San Luis Obispo the Statistics Department offers two courses on preparation for the Base SAS Certification and Advanced SAS Certification exams, respectively. Each of these courses is 10 weeks long and the topics covered follow the content offered in the certification guides offered by SAS.
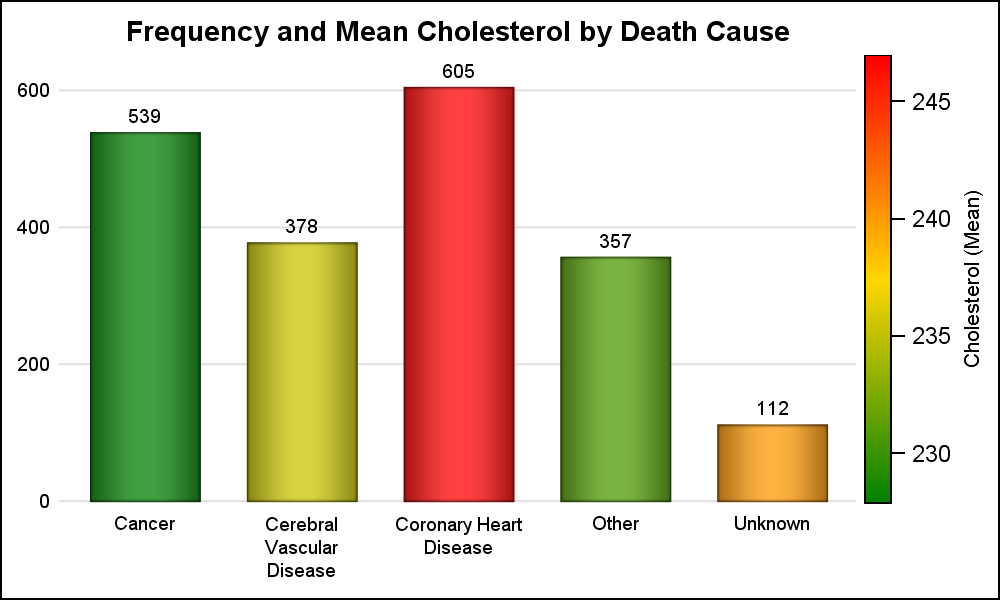

Often there is a need to display more than one response simultaneously for a bar chart, series plot or a vector plot. SAS 9.40M3 adds the options you need to get such results using two new options COLORRESPONSE and THICKRESPONSE where applicable. The Bar Chart on the right shows the frequency
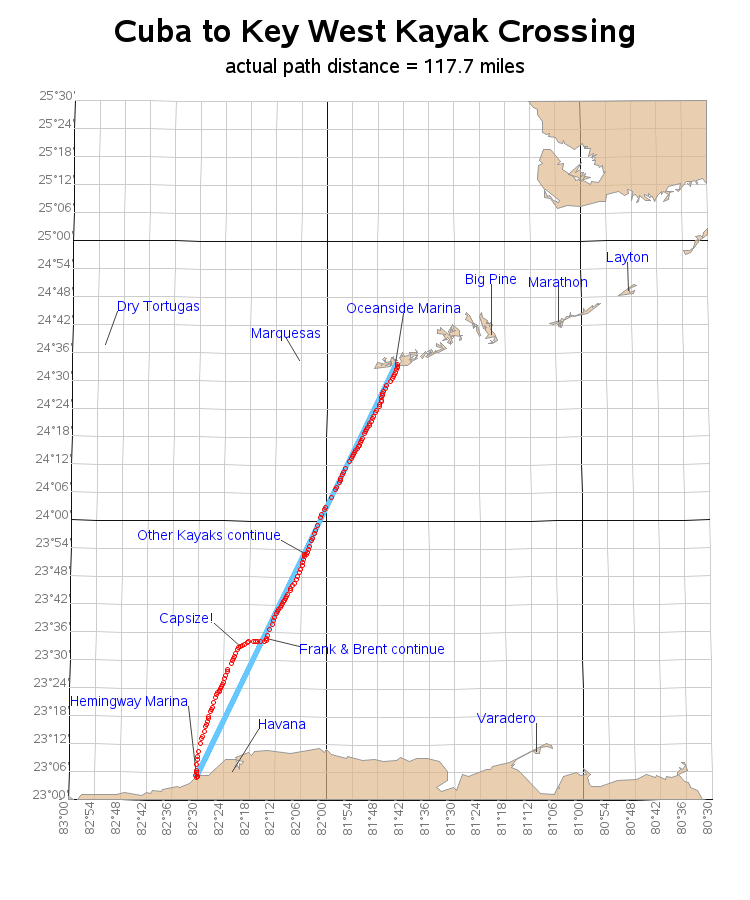
These days many devices (such as smart phone apps, Fitbits, Apple watches, dog tracking collars, car gps, hiking gps, teen/car trackers, etc) can track your location, and provide you with standard/canned ways to analyze the data. This blog post shows how I created a custom SAS map of the tracking
.@philsimon on the new challenges of an old problem.