All Posts
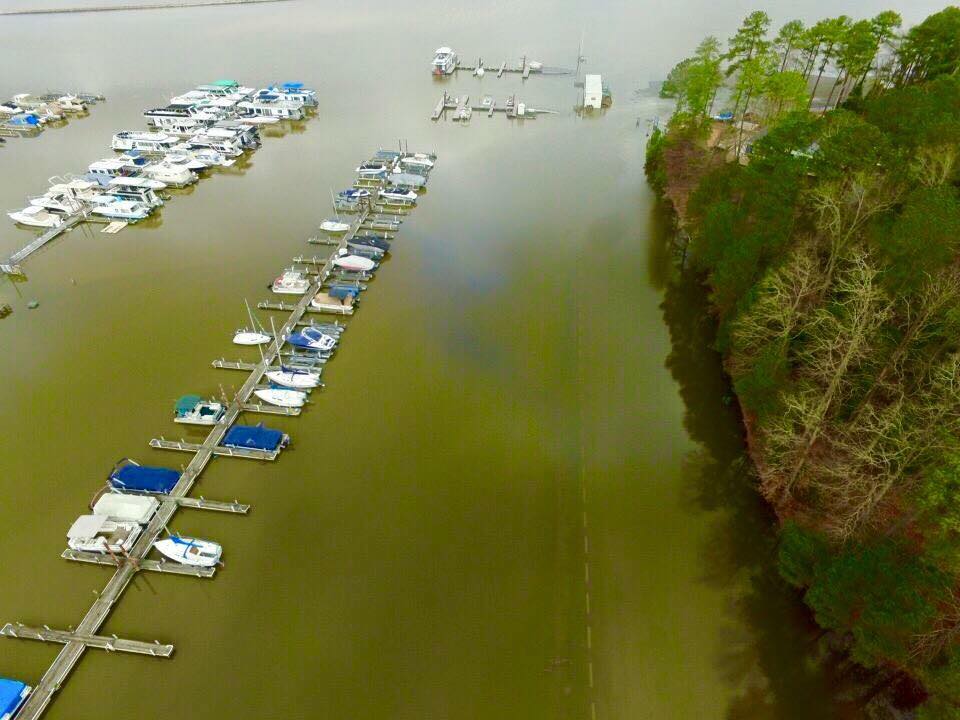

We recently had a flooding event at Jordan Lake where the water rose almost 20 feet above normal. This blog details that flooding event in both photos and graphs. If you're intrigued by weather, boats, or lakes then this blog's for you! In NC's Research Triangle Park area, there are basically two


.@philsimon lists the gravest data-quality errors.
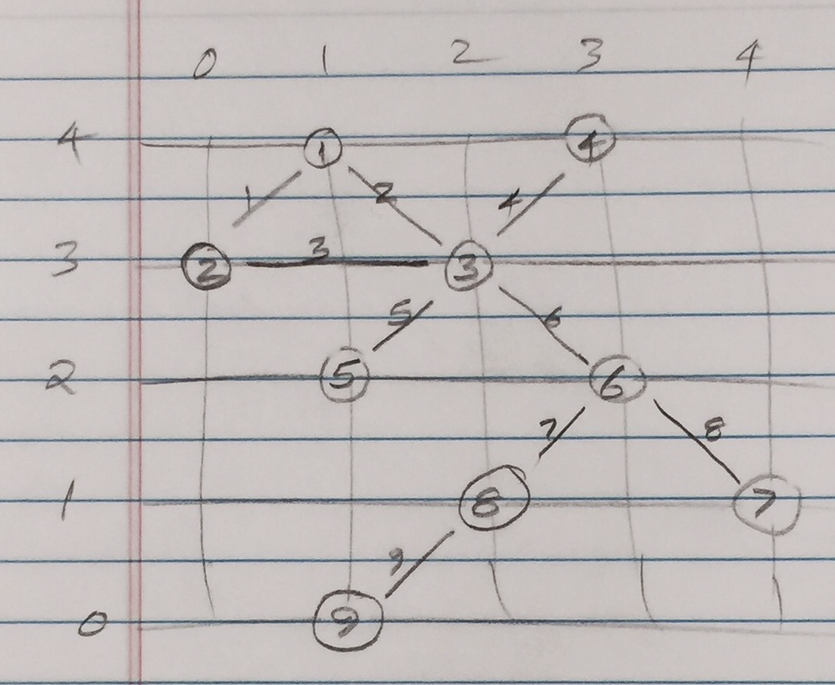

Let us continue with our journey beyond standard plots and charts. Often we need to create some simple diagrams to visualize the connections between different entities such as patients and providers or even a social network. Many of you may not have a custom tool to create diagrams. But you have Base SAS, so
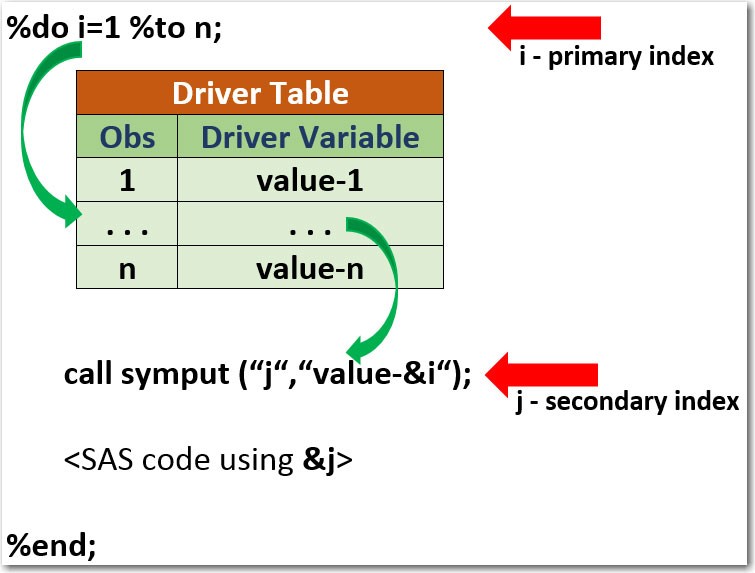

In my previous post, Introducing data-driven loops, I suggested a way of implementing programming loops with a list of index variables pulled from an external data table. These ordinary programming loops iterate during code execution while processing some data elements of an input data table. SAS macro loops, on the


In previous articles, I've shared tips about how you can work with SAS and ZIP files without requiring an external tool like WinZip, gzip, or 7-Zip. I've covered: How to create ZIP files with ODS PACKAGE ZIP (available since SAS 9.2) How to "unzip" and read ZIP files using FILENAME


In my previous blog post I talked about how the rapid and varied growth of data calls for states to consider an enterprise analytics program, in the form of a Center of Analytics. This entry, first posted as an article on Government Executive's Route Fifty, gives the most important success


This is my second article about voice of customer analysis; you can find the first here. The first time we discussed that a simple sentiment polarity score was a rather a narrow view. This time we will examine a more insightful approach, using voice of customer analysis to monitor customers’ opinions
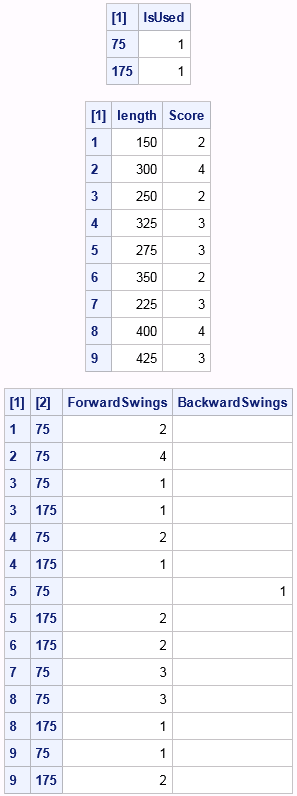
Here's a golf puzzle from Sam Loyd: Everybody is playing golf now, and even the lazy ones who a few weeks ago declared how much pleasanter it was to swing in a shady hammock, have caught the golf fever and are chasing the ball around the golf links. I am


I've been doing some investigation into Apache Spark, and I'm particularly intrigued by the concept of the resilient distributed dataset, or RDD. According to the Apache Spark website, an RDD is “a fault-tolerant collection of elements that can be operated on in parallel.” Two aspects of the RDD are particularly


El año pasado no fue fácil para la economía del país, por lo que este año se prevén riesgos de los cuales toda empresa debe estar consciente. La caída en los ingresos petroleros, la estabilización en los ingresos tributarios, el alza de tasas por parte de Fed y un crecimiento
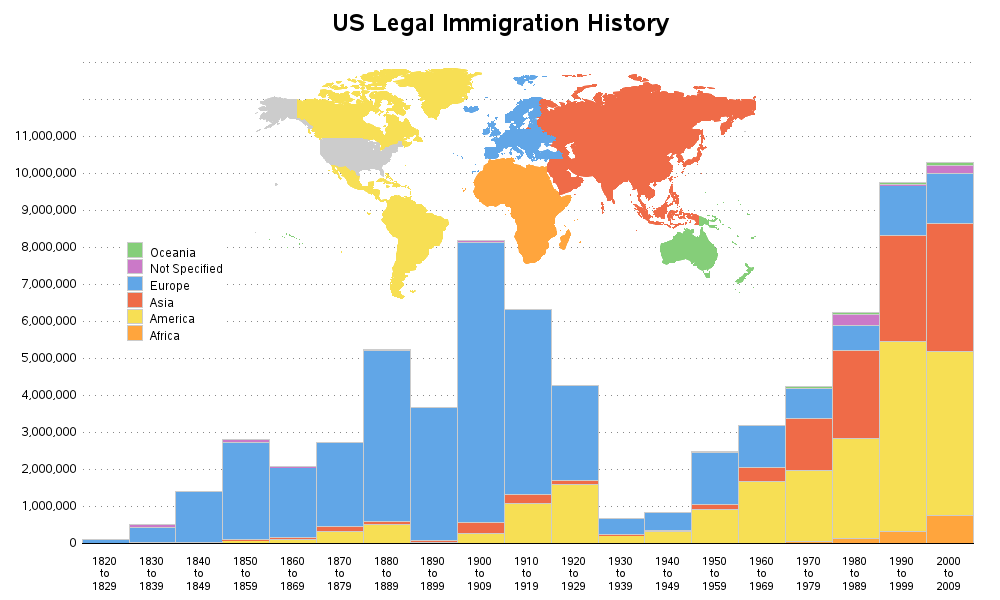
Have you ever found a graph of some interesting information, but the graph was difficult to understand (or even misleading). I strive to fix those graphs - this time it's a graph of US immigration data... I found the following immigration graph on the flowingdata website - it's a screen-capture of


¿Cómo las empresas pueden gestionar adecuadamente su gran volumen de información? ¿Están los datos de su organización listos para convertirse en la clave para alcanzar sus objetivos empresariales? ¿Cómo tomar las mejores decisiones a partir de la analítica? No cabe duda, en un mundo cada vez más conectado el Big


As the torrential downpour of rain and gusty winds hit The Triangle and much of the south last week, I was keenly aware of behavior…my dog’s behavior. With the wetness of their paws, they would enter the house and immediately sit on a towel so we could dry them. Opportunity to


I recently received a call from a colleague that is using parallel processing in a grid environment; he lamented that SAS Enterprise Guide did not show in the work library any of the tables that were successfully created in his project. The issue was very clear in my mind, but


It’s hard to believe, but SAS Global Forum 2016 is less than two months away. As chair of this year’s conference, I’ve been preparing for the event for nearly two years. Now, it’s right around the corner! Lately, I’ve been spending a lot of time reading and contributing to the