All Posts
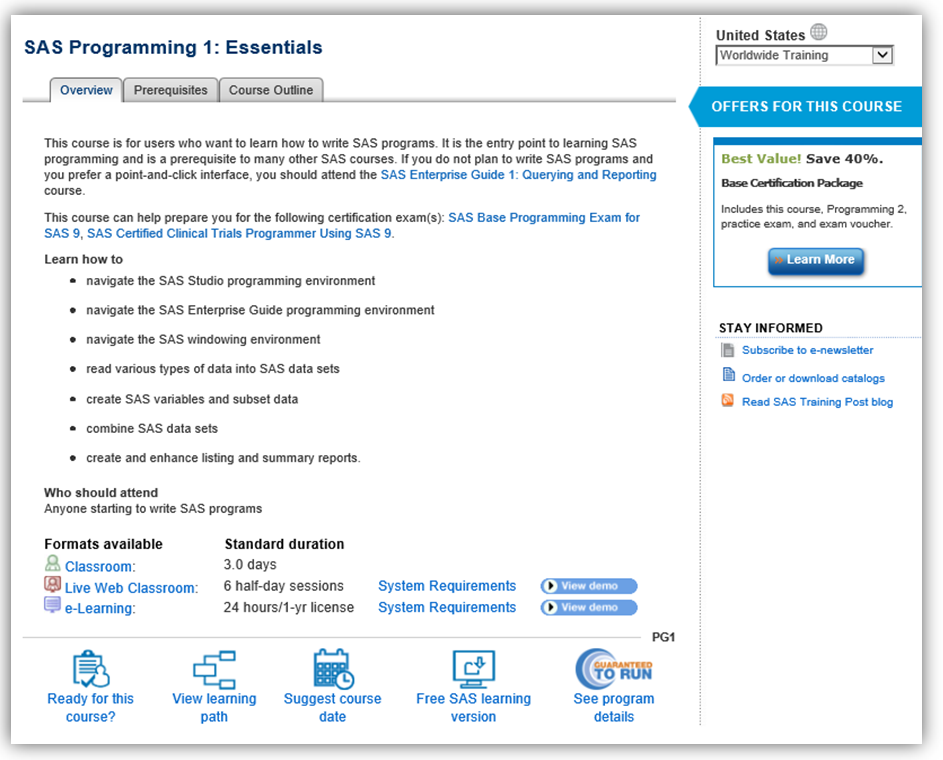

As an instructor for SAS, I receive a wide variety of queries before, during and after delivering my courses. Most frequently, I am asked questions such as: Should I learn SAS programming or a point and click tool instead? I know lots of code, should I go straight to the
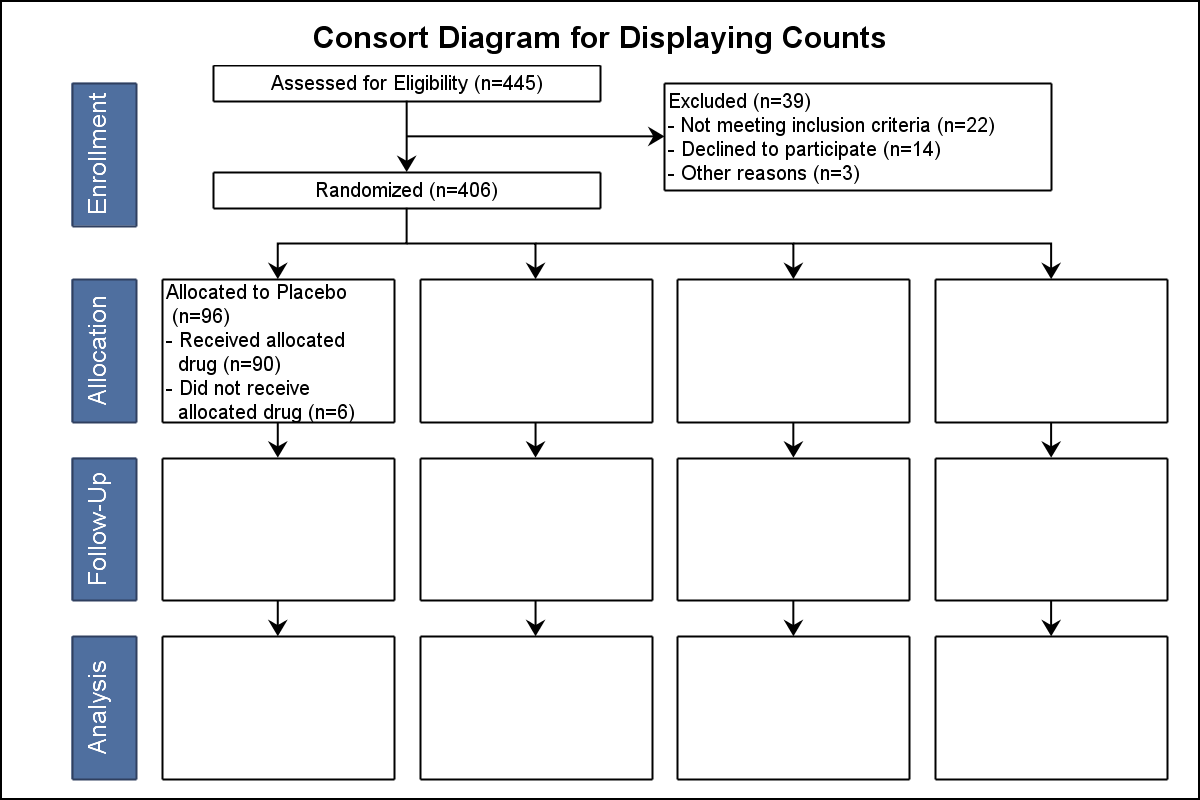

Over the past few weeks I have heard about the "Consort Diagram". This was mentioned in a Communities article, and also by a couple of users separately. This topic was also covered by Anusha Mallavarapu and Dean Shults from Cytel in a poster at PhUSE 2016 as shown on the


Data governance plays an integral role in many enterprise information initiatives, such as data quality, master data management and analytics. It requires coordinating a complex combination of factors, including executive sponsorship, funding, decision rights, arbitration of conflicting priorities, policy definition, policy implementation, data stewardship and change management. With so much overhead involved in
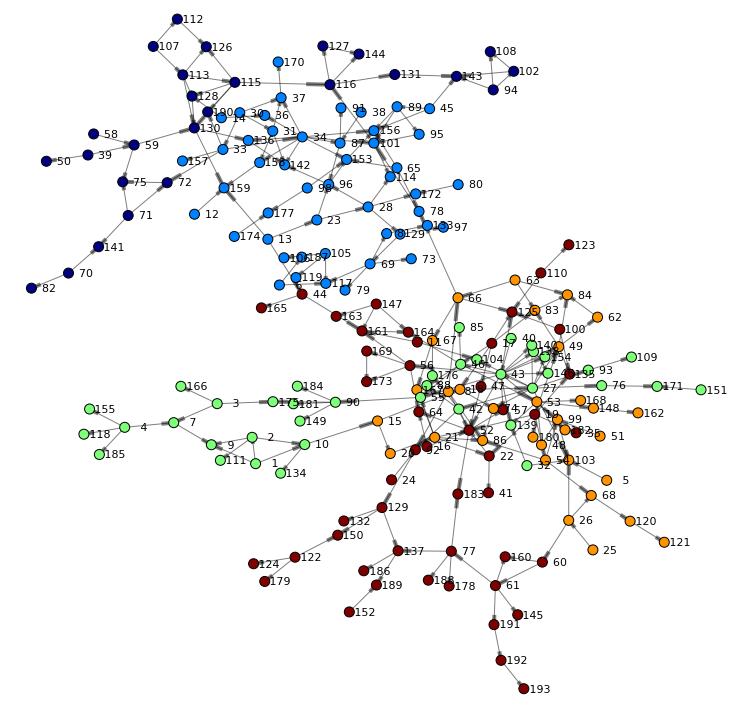

The study of social networks has gained importance over the years within social and behavioral research on HIV and AIDS. Social network research can show routes of potential viral transfer, and be used to understand the influence of peer norms and practices on the risk behaviors of individuals. This example analyzes the
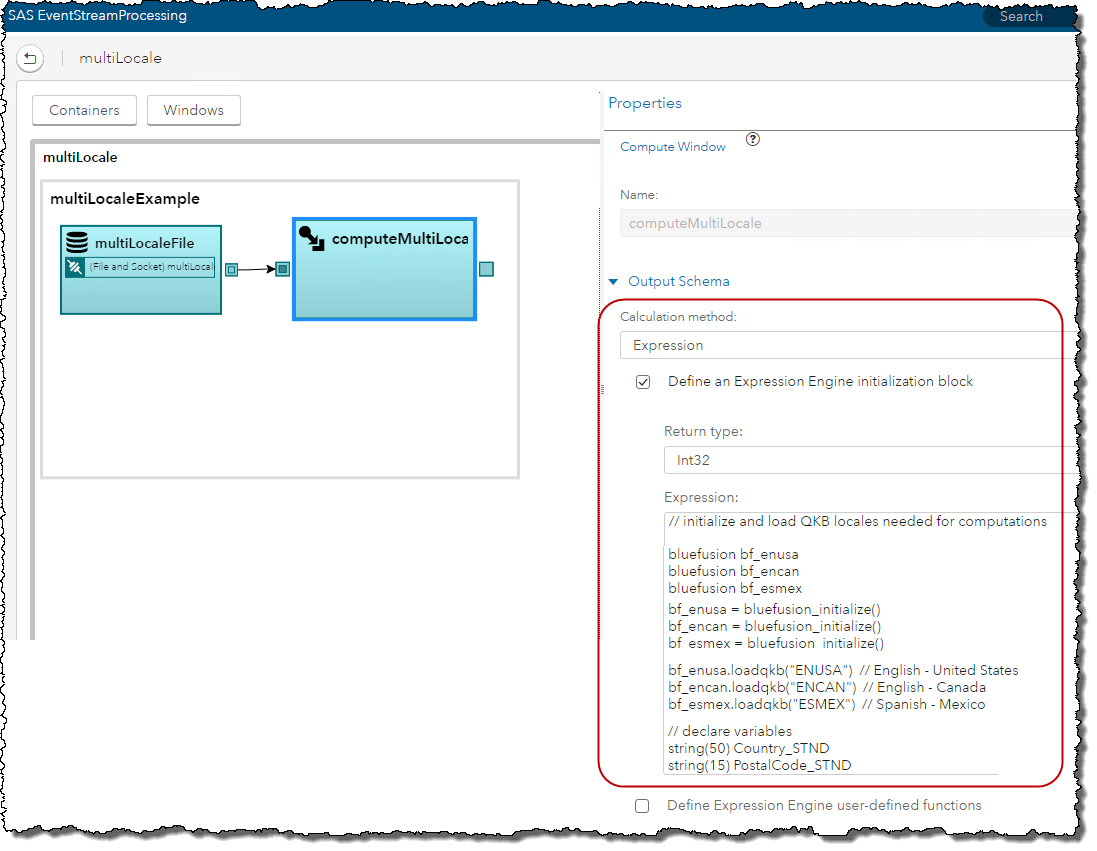

In a previous blog post, I demonstrated combining the power of SAS Event Stream Processing (ESP) and the SAS Quality Knowledge Base (QKB), a key component of our SAS Data Quality offerings. In this post, I will expand on the topic and show how you can work with data from

No cabe duda de que la analítica ahora está en todas partes. Gracias a la Nube (cloud) se puede acceder a las soluciones desde cualquier lugar y aplicarla en todo lo que nos imaginemos. Incluso en una pista tan sofisticada y tecnológica como resulta ser la de la Fórmula 1,


Eighteen years ago, on a cold and rainy day, I was frustrated. It had been three weeks since I made the discovery. Yes, the ultrasound declared it a solid mass and not a cyst. No, the mammogram didn’t know exactly what it was. I agreed to wait eight weeks to
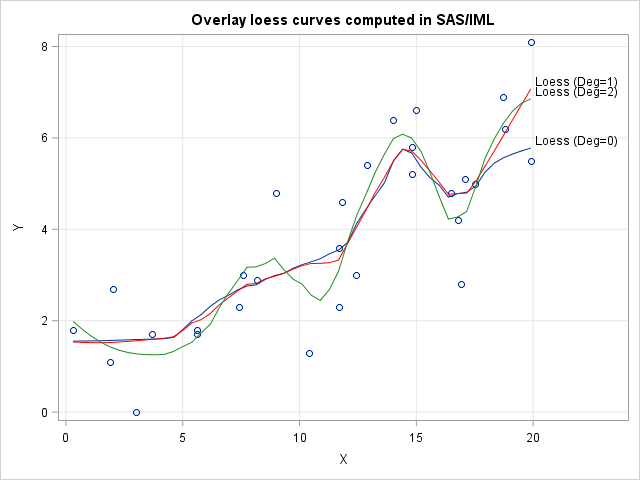

A previous post discusses how the loess regression algorithm is implemented in SAS. The LOESS procedure in SAS/STAT software provides the data analyst with options to control the loess algorithm and fit nonparametric smoothing curves through points in a scatter plot. Although PROC LOESS satisfies 99.99% of SAS users who


Cuando Social Media comenzaba a ganar popularidad entre las personas y las marcas, comenzaron a surgir creencias acerca de la disminución de interacciones “reales” o “cara a cara”, puesto que se desarrollaron a la par, soluciones que permitían realizar casi todo desde dispositivos conectados a internet: desde actividades cotidianas, hasta


Utility leaders are struggling with a world that's quickly changing and barely recognizable from the one they knew growing up. Many of the old assumptions are gone, and the business model upon which careers have been built is on the verge of disappearing. So what does the internet of things


Hadoop may have been the buzzword for the last few years, but streaming seems to be what everyone is talking about these days. Hadoop deals primarily with big data in stationary and batch-based analytics. But modern streaming technologies are aimed at the opposite spectrum, dealing with data in motion and
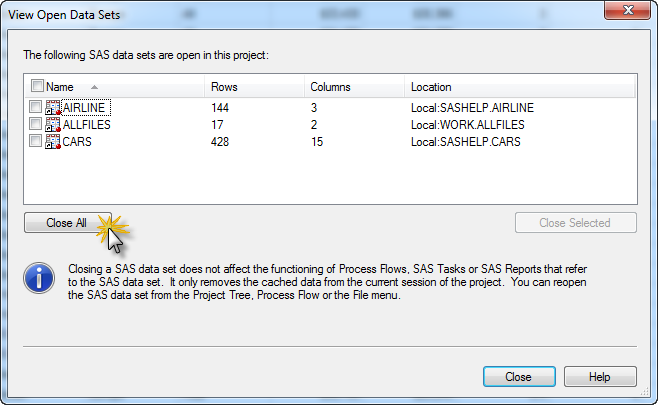

Have you seen this error when running a program in SAS Enterprise Guide? ERROR: You cannot open WORK.YOURDATA.DATA for output access with member-level control because WORK.YOURDATA.DATA is in use by you in resource environment IOM ROOT COMP ENV. Or maybe: ERROR: A lock is not available for LIB.YOURDATA.DATA. NOTE: The


With the US Affordable Care Act (ACA) and other health topics in the news lately, I wondered how much people spend on healthcare in various countries. Of course spending varies from person to person, so I decided to take a look at the average per capita spending in each country (it's


Open. The very word evokes a sense of happiness and possibility. When you’re hungry at an odd hour and everything around you seems to be closed, that lone neon sign glowing in a restaurant window is a most welcome relief. When a shop or service you’ve longed for finally builds


In Part 1 of this series, we defined data governance as a framework – something an organization can implement in small pieces. Data management encompasses the disciplines included in the data governance framework. They include the following: Data quality and data profiling. Metadata (business, technical and operational). Data security. Data movement within the enterprise.