All Posts


What is automated prediction? Automated prediction, in less than a minute, runs several analytic models (such as decision trees, gradient boosting, and logistic and linear regression) on a specific variable of your choice. Most of the remaining variables in your dataset are automatically analyzed as factors that might influence your specified variable. They are called underlying factors. SAS then chooses the one model (champion model) that most accurately predicts your target variable. The model prediction and the underlying factors are then displayed. You can adjust the values of the underlying factors to determine how the model prediction changes with each adjustment.


Remember Subconscious Musings? It was the name of the blog Radhika Kulkarni (now retired Vice President of SAS R&D) started in 2012. She wrote about trends that drove innovation and challenges that expanded the boundaries of what we thought was possible. It eventually evolved into what we now know as
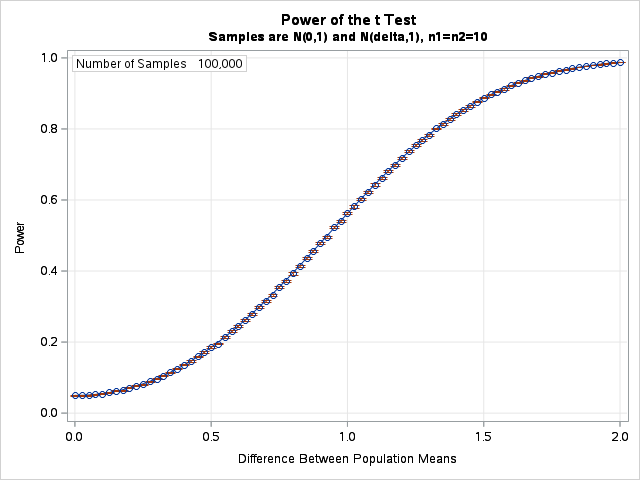

I recently showed how to use simulation to estimate the power of a statistical hypothesis test. The example (a two-sample t test for the difference of means) is a simple SAS/IML module that is very fast. Fast is good because often you want to perform a sequence of simulations over


“El deporte moderno se ha convertido en una gigante base de datos que hay que saber entender para obtener los mejores resultados”, dice Jhon Jairo Osorio, un reconocido periodista deportivo colombiano especializado en ciclismo. Jhon Jairo suele participar como comentarista en las transmisiones que canales de televisión colombianos hacen de


Lisa Lucas explains why people, knowledge and tech are vital for contact tracing.


Could you pass a test on coronavirus testing terms? Jim Harris can help.


Vivimos en la era de la hiperconectividad, nos comunicamos con el mundo en un entorno cada vez más digital. Y, precisamente, una de las principales consecuencias del COVID-19, al margen de las sanitarias y las socioeconómicas, ha sido una significativa aceleración de la digitalización tanto a nivel individual como empresarial.


Bone broth has been around for centuries, it’s the traditional way to make soup or stew. It just seems like a new thing since many of us don’t tend to make soups or broths from scratch anymore. It has become popular due to its supposed healing properties as well.


As he watched me unpack yet another Amazon delivery, my husband decided to do an intervention. Scattered around me on the floor were solar panels, water purification tablets, tarps, hunting knives and enough batteries to power New York City for many weeks. It was 2019 and hurricane season was upon


SAS' Leonid Batkhan reveals how to change lengths for all character variables in a data set and all data sets in a data library to facilitate data migration to Unicode encoding environment.
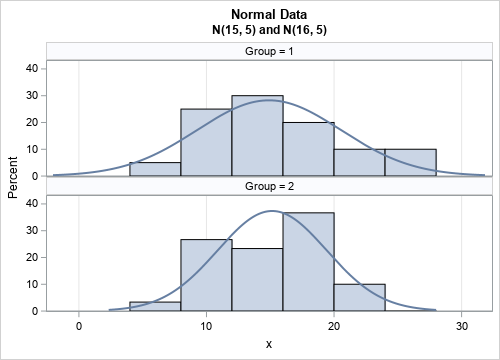
A previous article about standardizing data in groups shows how to simulate data from two groups. One sample (with n1=20 observations) is simulated from an N(15, 5) distribution whereas a second (with n2=30 observations) is simulated from an N(16, 5) distribution. The sample means of the two groups are close

Hidden Markov Models Introduction Statistical models of hidden Markov modeling (HMM) have become increasingly popular in the last several years. The models are very rich in mathematical structures and can form the theoretical basis of many real applications. In the classical continuous/discrete Markov process, each state corresponds to an observed

The most fundamental concept that students learning introductory SAS programming must master is how SAS handles data. This might seem like an obvious statement, but it is often overlooked by students in their rush to produce code that works. I often tell my class to step back for a moment


Katherine Taylor explains how and why new data improves risk models.
A common operation in statistical data analysis is to center and scale a numerical variable. This operation is conceptually easy: you subtract the mean of the variable and divide by the variable's standard deviation. Recently, I wanted to perform a slight variation of the usual standardization: Perform a different standardization