
One aspect of the COVID-19 crisis that I find interesting is how it’s caused us to fast-forward to the leading-edge in so little time. This is particularly noticeable in science and medicine, but even in financial services the crisis has compelled the use of new technologies and business models. In risk modeling, it has accelerated the move into the era of new data.
New data is generally observed with higher frequency and is much more granular than traditional data. In the financial services industry, most economic and behavioral models have not responded quickly enough to the massive economic shocks of the pandemic. This reveals an urgent need for models to use new types of data.
But taking full advantage of this data is still an aspiration for many – partly because processing it requires new technology and new skills. Even though it’s a daunting task, it is certainly doable. To get started, we must:
- Recognize why new data is needed.
- Identify what data is needed to improve our models.
- Make sure we consider what will be different when using this data in our models.
Why new data?
At the center of the current economic crisis is a public health crisis. The spread of the virus and the policies enacted in response will be the main drivers of economic behavior for the foreseeable future. Models that are most responsive to the evolution of the COVID-19 pandemic will outperform traditional models in the near term.
Further, the current environment has changed the characteristics of data and the relationships between data. Model assumptions may no longer be valid, and models may require new data to produce reasonable results. This is particularly true of sector aggregate models and models that use proxy variables.
Finally, the crisis has revealed just how much can change in a short period of time. Data that captures changes on a granular level and reflects current conditions is necessary to make good decisions during this time. This approach will also establish model resiliency going forward.
What new data?
The digitalization of data collection has created more frequent and more granular data. Following are examples of some types of new data you can use to improve risk models.
Macro level
For data that captures behavior at a regional or national level, consider updating traditional indicators – like unemployment, CPI or GDP – with these more frequent indicators:
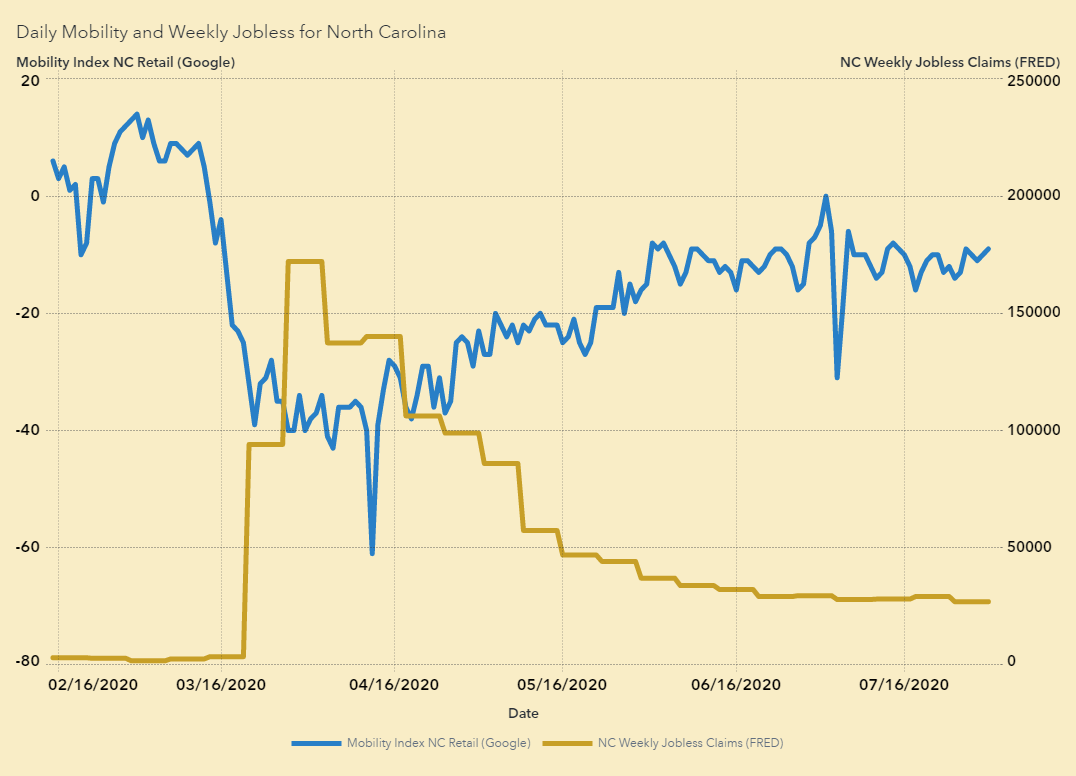
- Weekly jobless claims.
- Weekly mortgage loans, house price indices and construction starts.
- Daily mobility indices, weekly restaurant reservations and weekly movie ticket sales.
- Air travel and hotel occupancy rates.
- Online shopping price indices.
- Real-time credit card transactions.
Some organizations, including the Federal Reserve in the United States and the US Census Bureau, publish frequent economic indicators. For example, consider the Weekly Economic Index and the Household Pulse Survey. There are also COVID-19 specific indices that are interesting, such as a shut-down stringency index out of Oxford University.
Corporate level
There’s been a breakdown in the way we can generalize company behavior within sectors and geographies – the traditional approach no longer works. We now need more granular data to evaluate companies on an individual level.
Alternative data sources include a company’s transactional data for gauging risk from things like revolving credit drawdowns and changes to spending habits. Also, company-specific information from press releases, news and other text can provide a fundamental view of a company’s health.
Individual level
The financial situations of many individuals have changed drastically in this crisis environment, too. It’s hard to generalize who has been affected. An individual’s transaction data, when available, is helpful. Because changes in account flows or spending habits can indicate in near-real time where risk may be developing.
How using new data is different
When using more frequent, more granular data, you are more likely to pick up temporary swings. The purpose of your model will determine if you should keep the raw data or if you should smooth the data and quiet the noise.
This new data is also likely to pick up more nuanced behavior – and this may come at the cost of model simplicity and explainability. For example, the relationship between a mobility index and economic activity will depend on several factors. These include the context of the COVID-19 pandemic, what heath officials and infectious disease experts are saying, and what other information shows, including COVID-19 testing data. The field of model interpretability offers good tools to address this.
Another significant difference with new data – its sources are often too large to manage and process manually. Machine learning can be a big help in automating preparation and getting insight from the data. For text data, machine learning is essential.
It’s time to seize the new opportunity
For most firms, updating the model process to use new data has been on the horizon as an opportunity for some time. Now, circumstances make it a necessity. It’s challenging to take such a large leap forward. But hopefully, we’ll soon find ourselves looking back from the other side – satisfied with how we’ve responded and adapted to these changing times.
Learn how SAS can help you adapt and plan for the future