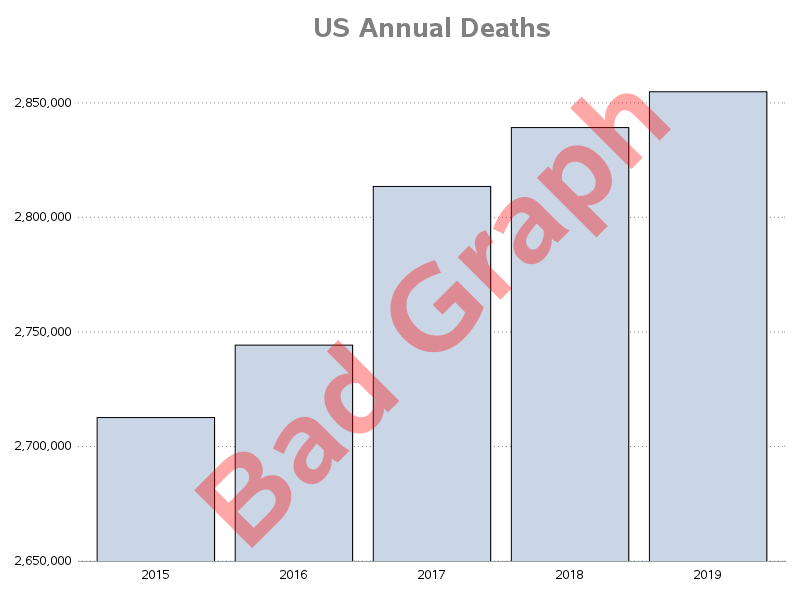
Tag: VBARPARM

Data Visualization
Sanjay Matange 0
Should we move to Ireland?

Recently, while browsing health care data, I came across the graph shown below.  The graph includes the healthy life expectancy at birth by countries in the EU, along with the associated per capita expenditure.  The graph also shows estimate of potential gain in life expectancy by increasing expenditure efficiency. The

Data Visualization
Sanjay Matange 0
Likert Graph Revisited

A few weeks back I posted an article on ways to create a WindRose Graph using SGPLOT procedure.  The process is relatively simple.  Create (R, Theta) data with both numeric axes where the Theta is a value in the data range is 0-360, and R is the corresponding response value.  Then

Data Visualization
Sanjay Matange 0
Fun with Bar Charts

As Sheldon Cooper would say, this is the first episode of "Fun with Charts".  I did not find a cool term like "Vexillology" and "Cartography" is taken by map making, so let us go with "Chartology". Yesterday, I saw a couple of interesting bar charts as shown on the right.  I thought

Data Visualization
Sanjay Matange 0
Likert Graphs

Just this morning I received a request for a brief survey from Apple on my feedback about the new iPhone6+.  Yes, I finally got one, dead last in the family.  The survey followed the usual format, with a number of questions on what I like or dislike about it, with

Data Visualization
Sanjay Matange 0
Parametric Bar Charts

A parametric bar chart in SG Procedure and GTL parlance is a simplified version of the regular bar chart, where the data is assumed to be summarized prior to its usage inside the SG procedures or GTL.  So, multiple occurrences of the same category and / or group combination is

Data Visualization
Sanjay Matange 0
Custom confidence intervals

Recently a user posted a question on the SAS/GRAPH and ODS Graphics Forum about drawing a plot with custom confidence intervals .  The user has a simple data set with category, response (mean) and custom lower and upper confidence intervals.  The data looks like this: Robert Allison provided the code (proc gplot +