A dual response axis chart is useful when the data type for the multiple measures are not compatible. For example, when overlaying measures like "This Year" sales with "Last Year" sales, the format and magnitudes of the two measures (or values for two groups) may be compatible, and it is useful to view the data with only one response axis.
But, when the two measures have incompatible formats, such as when one is linear and other is percent, then it is better to view the data using two separate response axes, Y and Y2 as shown in the graph below.
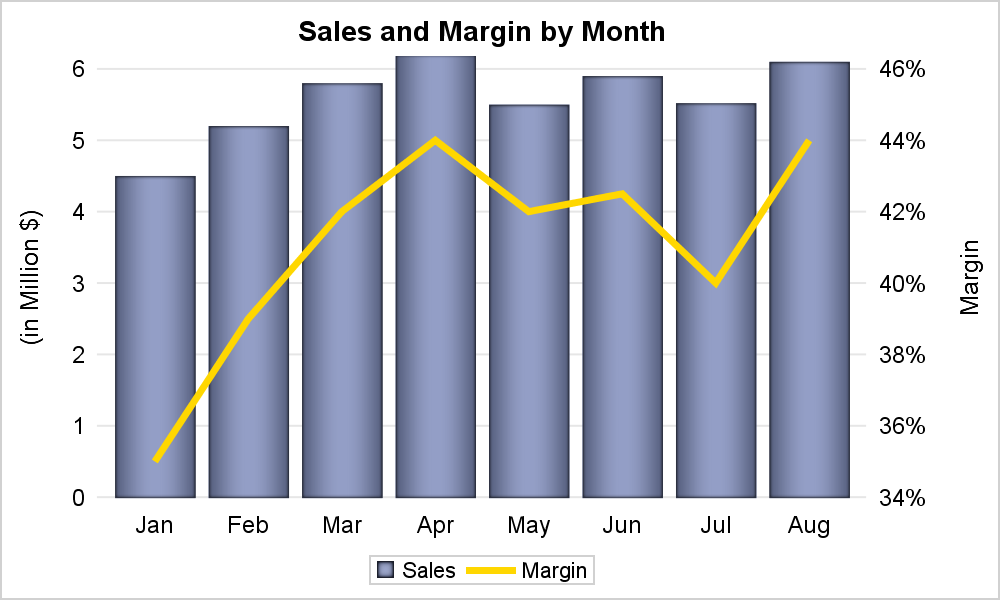
title 'Sales and Margin by Month';
proc sgplot data=sales noborder;
vbar month / response=Sales dataskin=pressed baselineattrs=(thickness=0) fillattrs=graphdata1
name='a' nostatlabel;
vline month / response=margin y2axis lineattrs=(color=gold thickness=4) nostatlabel name='b';
xaxis discreteorder=data display=(noline nolabel noticks);
yaxis display=(noline noticks) grid label='(in Million $)' values=(0 to 6 by 1) offsetmin=0;
y2axis display=(noline noticks) values=(0.34 to 0.46 by 0.02) offsetmin=0;
keylegend 'a' 'b' / title='' linelength=24;
run;
In the graph and code shown above, the VBAR is plotted with the left side (default) Y axis. The VLINE is plotted with the right side Y2 axis using the Y2AXIS option. Turning on the GRID lines for both axes can cause problems if the tick values are not aligned. So, it is useful to enable GRID only on one axis, and then ensure the other axis has the same number of tick intervals, as in the example above.
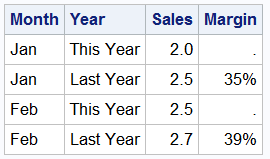 In this example, the data is grouped by Year. The Sales column has values for "This Year" and "Last Year", while the Margin has values for only one year, the other year is missing as shown on the right. The Margin column has a percent format.
If we display the same graph grouped by Year, we will get the graph shown below.
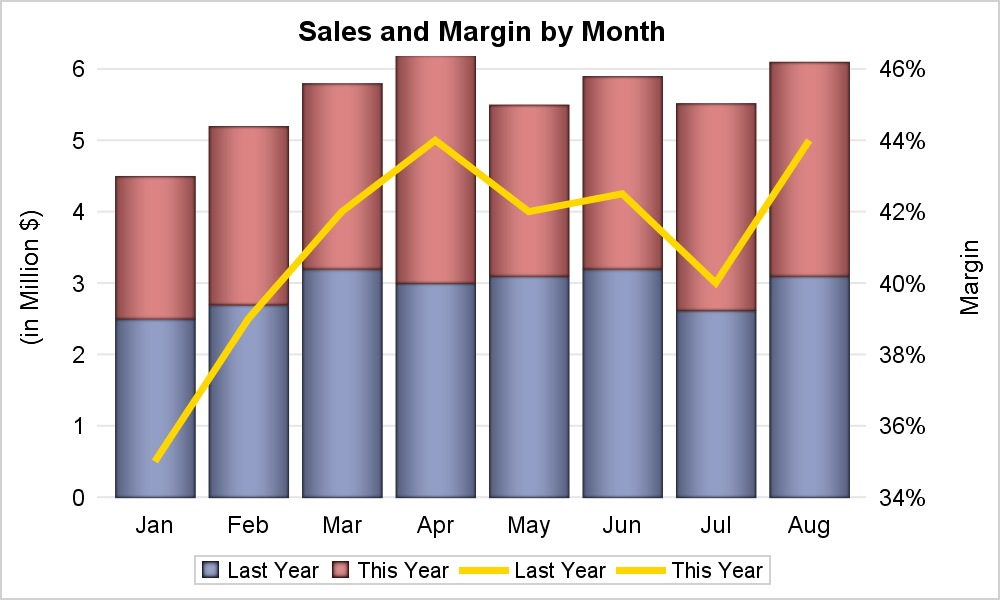
Here we have used the GROUP option on both the VBAR and the VLINE. This is necessary as you can use VBAR and VLINE together ONLY when the category role on each statement is the same. When GROUP role is used, this must also be the same on both the statements. These are shown below.
title 'Sales and Margin by Month';
proc sgplot data=sales noborder;
vbar month / response=Sales group=year dataskin=pressed name='a';
vline month / response=margin group=year y2axis lineattrs=(color=gold) nostatlabel name='b';
xaxis discreteorder=data display=(noline nolabel noticks);
yaxis display=(noline noticks) grid label='(in Million $)' values=(0 to 6 by 1) offsetmin=0;
y2axis display=(noline noticks) values=(0.34 to 0.46 by 0.02) offsetmin=0;
keylegend 'a' 'b' / title='' linelength=24;
run;
Both statements have Month as the category and Year as the group. The layering is accepted by the procedure, and the line is layered over the bars using the Y2 axis. However, note the legend at the bottom now has two entries for the line, one for "Last Year" and one for "This Year". The legend does not care that all the values of Margin for "This Year" are missing. Both are gold color because we set it so on the code.
The Y and Y2 axis options have been set to make the offsets the same and also the number of tick intervals. This allows the Y grid lines to line up with the Y2 tick values.
So, what can we do about the two entries in the legend?
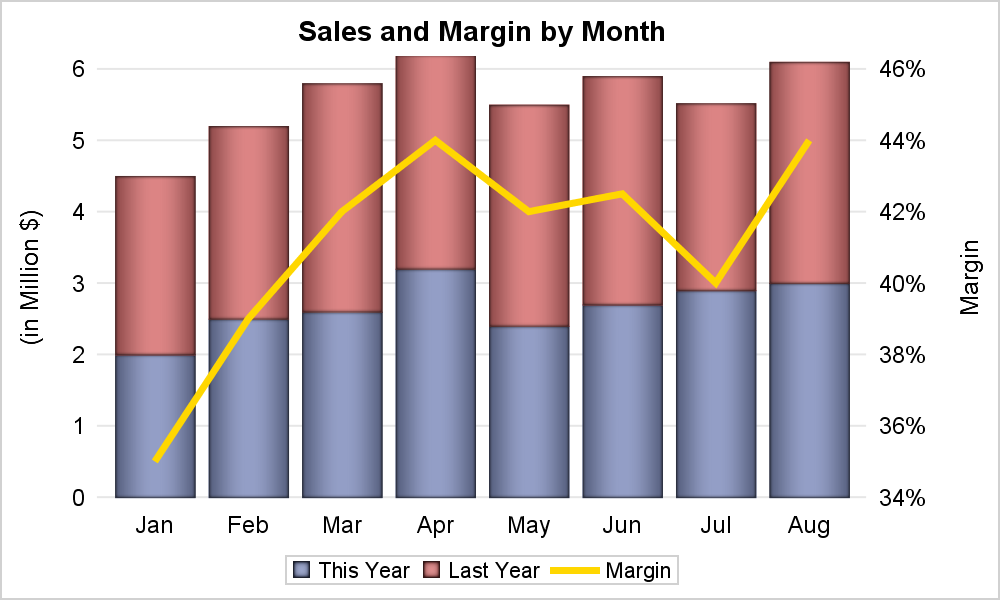
There are multiple ways to address this situation. In this article, let us discuss the solution that will work in this case since the data is already summarized by Month and Year. There is only one observation per unique combination of Month and Year. So, we can use the VBARPARM statement to render the bar chart. Here is the new graph and code.
title 'Sales and Margin by Month';
proc sgplot data=sales noborder;
vbarparm category=month response=Sales / group=year dataskin=pressed name='a';
series x=month y=margin / y2axis lineattrs=(color=gold thickness=4) name='b';
xaxis discreteorder=data display=(noline nolabel noticks);
yaxis display=(noline noticks) grid label='(in Million $)' values=(0 to 6 by 1) offsetmin=0;
y2axis display=(noline noticks) values=(0.34 to 0.46 by 0.02) offsetmin=0;
keylegend 'a' 'b' / title='' linelength=24;
run;
Now, we have used the VBARPARM statement to render the grouped bar chart. The default grouping method is stack. The line is displayed using the SERIES plot. Since no summarization is done by the VBARPARM statement, we can overlay a SERIES plot on it. Note it is important to NOT specify the MISSING option or the alternate missing values will interrupt the curve. Alternately, you could have a whole different category column, say Month2, with only single value for each month, with the appropriate Margin values in another column. That will work too.
One last point for this article. Stacking the year values may not be very useful for comparison of the Sales numbers for the two years. The values for this year and last year can be better compared by using CLUSTER grouping as shown in the graph and code below.

title 'Sales and Margin by Month';
proc sgplot data=sales noborder;
vbarparm category=month response=Sales / group=year groupdisplay=cluster
dataskin=pressed baselineattrs=(thickness=0) name='a';
series x=month y=margin / y2axis lineattrs=(color=gold thickness=4) name='b';
xaxis discreteorder=data display=(noline nolabel noticks);
yaxis display=(noline noticks) grid label='(in Million $)' values=(0 to 3 by 0.5) offsetmin=0;
y2axis display=(noline noticks) values=(0.34 to 0.46 by 0.02) offsetmin=0;
keylegend 'a' 'b' / title='' linelength=24;
run;
Some statement options were trimmed in the code samples above to fit the page. See the full code in the link below. We will discuss some other ways to deal with such graphs in Part 2.
SAS9.4 SGPLOT Code: Bar_Line_Overlay


1 Comment
Thank you for this fantastic guide!
I need to create a clustered graph with two Y axes (exactly the same data structure and graph template as the last example). Also, need to break the left Y-axis. The range option in the yaxis statement did not help me. It might be because of the restriction mentioned in the SAS documentation
"
Restrictions This option is valid for linear and time axes only.
Only one axis can be broken. If this option is specified for both axes, then it is honored for the vertical axis and ignored for the horizontal axis.
If this option is specified for both axes in the same direction (X and X2 or Y and Y2), then only the primary axis is broken.
When plots are associated with both the X and X2 axes or with both the Y and Y2 axes, neither axis can be broken."
Do you have any recommendation to have a dual response variable and also break the Y axis?