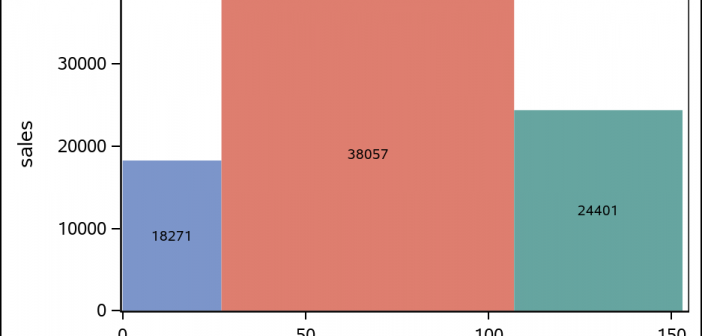
The SGPLOT procedure supports a wide variety of plot types that you can use directly or combine together to create more complex graphs. Even with this flexibility, there might be times you run across a graph that you cannot create using one of the standard plot types. An "area" bar

