Recently a colleague was requested to create a bar chart showing the performance of students in a school compared to county and state wide schools. The solution using SGPLOT was simple as shown below. /*--Create data--*/ data school; input Year Group $ Value; format Value percent5.1; datalines;
Search Results: vbar (97)
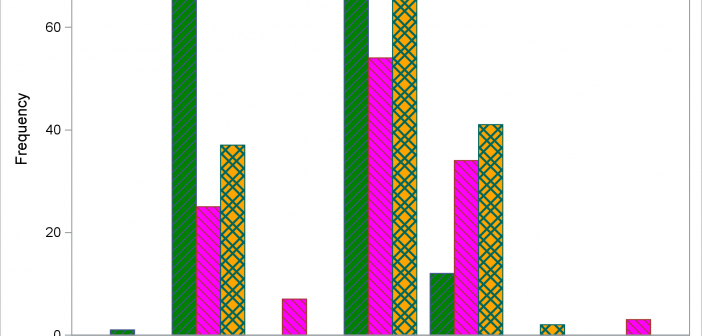
The STYLEATTRS statement in PROC SGPLOT enables you to override colors, markers, line patterns, fill patterns, and axis break patterns in ODS styles, without requiring you to change the ODS style template.
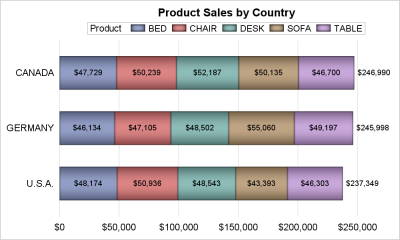
A common request on the communities page is to place data labels on horizontal bar charts. Often users want to display stacked horizontal bar charts, with the values displayed for each segment and the overall value of the bar itself as shown in the example below. In this example, the
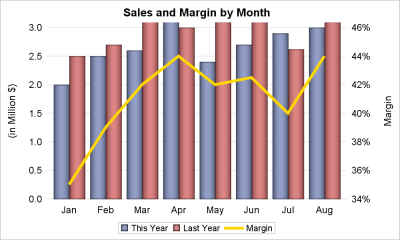
A dual response axis chart is useful when the data type for the multiple measures are not compatible. For example, when overlaying measures like "This Year" sales with "Last Year" sales, the format and magnitudes of the two measures (or values for two groups) may be compatible, and it is
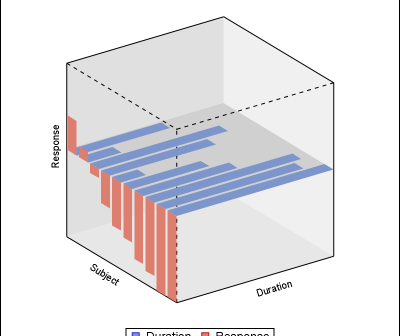
A few months ago, a user inquired about a chart that showed tumor response and treatment duration for each subject on 2 different planes of a 3D view. The data was really 2D, with one independent variable (the subject id) and two or more response values. I had provided an
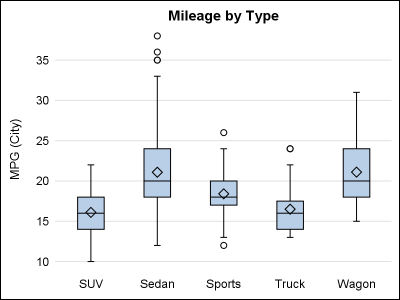
The SG procedures and GTL statements do a lot of work for us to display the data using the specified statements. This includes setting many details such as arrow heads, line patterns etc, including caps. Often, such details have a fixed design according to what seems reasonable for most use
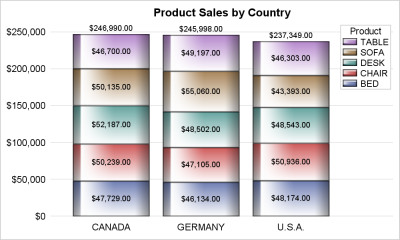
Once in a while you run into a pesky situation that is hard to overcome without resorting to major surgery. Such a situation occurs when you have a stacked bar chart with a discrete legend positioned vertically on the side of the graph. A simple example is shown below. title
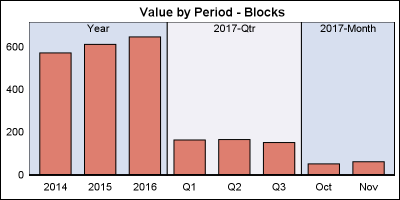
Off and on, users have expressed the need to include multiple blank categories on a discrete axis. Often, this is desirable to separate groups of bars (or categories) in a graph due to some difference their definition. Such a case was discussed in this blog article on using non breaking
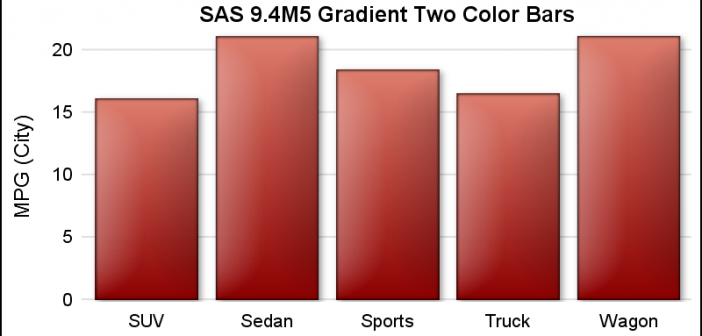
ODS Graphics procedures primarily strive towards the following goal: "Make simple graphs easy and complex graphs possible". SGPLOT procedure allows you create simple graphs with a single plot statement, and create complex graphs by layering together or combining multiple plot statements. Generally, the appearance follows the guidelines set by industry
SAS 9.4 maintenance release 5 was released on Sept 19, 2017. This release includes many new items including integration with SAS Viya and SAS Studio, a web application for SAS development. Also Included with this release are some cool new features in the graphics domain, some of which were requested

