Search Results: graphs in column (120)

Data Visualization
Sanjay Matange 4
Likert Graphs

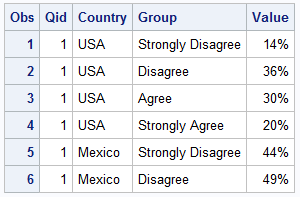
Just this morning I received a request for a brief survey from Apple on my feedback about the new iPhone6+.  Yes, I finally got one, dead last in the family.  The survey followed the usual format, with a number of questions on what I like or dislike about it, with

Data Visualization
Sanjay Matange 6
Layered graphs

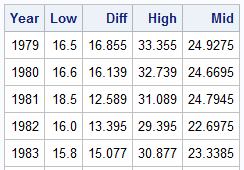
Browsing graphs on the web, this graph caught my eye:  The Arctic Sea Ice Volume Graph.   My interest is not so much in the debate on Climate Change or Global Warming.  To me, this graph has some interesting features that can help show the benefits of plot layering to

Data Visualization
Sanjay Matange 3
Sochi Medal Graphs

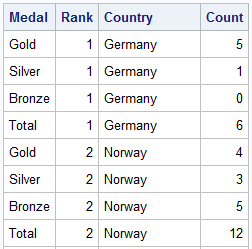
The attention of the world is now on Sochi and the Winter Games.  Gold, Silver and Bronze medals are being earned by these amazing athletes, and everyone has an eye on the tally.  Andre sent me a link to TRinker's R Blog, showing a graph of the current tally.  Andre

Data Visualization
Sanjay Matange 0
BarLine Graphs

A Bar Line graph is commonly used in many domains.  The SGPLOT procedure makes it easy to create bar line graphs where the user can customize it in many different ways.  This post is prompted by a recent question on the communities page on creating such a graph, with one bar and

Data Visualization
Sanjay Matange 1
High resolution graphs

Creating a graph that looks nice, with readable, high resolution fonts is important and should be easy to do.  With SG procedures and GTL, this is easy to do with a simple option, but not the default. Creating a high resolution (image) for a graph consumes higher system resources.  When working on a graph,

1 2 3 4 12