The SGPANEL procedure is used to create panelled graphics based on classification variables. The panelled cells are generated starting from either the top left (the default) or the bottom left of the panel, controllable by the START option. Currently, the ordering of the cells is determined by two criteria:
1. If the data is sorted by the panel classification variable(s) using PROC SORT or PROC SQL, that sort order will be used by SGPANEL.
2. If the data needs to be sorted by SGPANEL, the class variables will be sorted in ascending unformatted order.
There might be times when you want the cells to be sorted in a custom order. In SAS 9.4, the new SORT option on the PANELBY statement will give the ability to directly control the ordering of the cells, including data order and statistic order. However, there are some techniques that you can use in SAS 9.2 and SAS 9.3 to create custom cell orders. In this first installment, I will discuss the basics of creating a custom ordering. In the second installment, I will discuss how you can build on this technique to sort your cells by statistic.
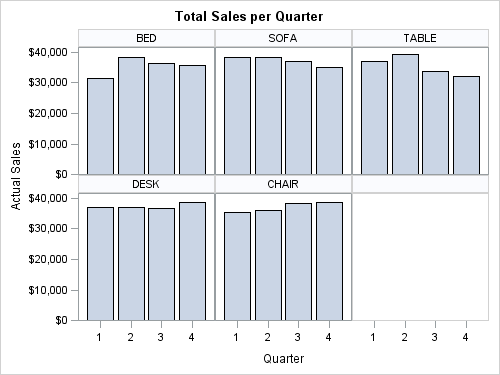
In the following example, the SGPANEL procedure automatically sorts the products in ascending order:

title "Total Sales per Quarter";
proc sgpanel data=sashelp.prdsale;
  panelby product / onepanel novarname;
  vbar quarter / response=actual;
run;
However, I want to sort the cells in order of descending size of product (from BED to CHAIR). With a little work, you can create this custom order and generate an output that looks like this:
proc sort data=sashelp.prdsale out=prdsale; by product; run;

data prdsale2;
set prdsale;
if (product eq "BED") then tag=1;
else if (product eq "SOFA") then tag=2;
else if (product eq "TABLE") then tag=3;
else if (product eq "DESK") then tag=4;
else if (product eq "CHAIR") then tag=5;
else tag=.;
run;

proc format;
     value product 1="BED"
                   2="SOFA"
                   3="TABLE"
                   4="DESK"
                   5="CHAIR";
run;

title "Total Sales per Quarter";
proc sgpanel data=prdsale2;
   format tag product.;
   panelby tag / onepanel novarname;
   vbar quarter / response=actual;
run;
To create this custom order, here are the steps that I used:
1. Sort the data by the classification variable(s)
This sort is done to get the data in order for tag value assignment (step 2). One important consideration in this step is the format used for the classification variables. Some formats can aggregate data in a non-linear fashion. For example, if you were to use a MONTH format on 5 years of data, all of the “January” data would be aggregated together across all 5 years, even if there is chronologically more data in between each January. If you have a format of this type, you should create a data step before the sort that creates a column of formatted values. Then, sort this column instead of the original classification column.
2. Assign a numeric value to each classification value
In the example, I created a new column in the data step called “tag” that is used to hold the numeric assignment of each classification value. This column will become the column we use on the PANELBY statement. The procedure will automatically sort these numbers in ascending order, so keep that in mind as you make you assignments. If you needed to pre-format your data before step 1, be sure to use the formatted column values when you are making your assignments.
3. Create a user-define format to assign the classification values back to the numeric tag values
This format will be used by the procedure to turn the numeric values back into the original classification values for display in the graph. If you needed to pre-format your data before step 1, be sure to use the formatted string values here.
4. Run PROC SGPANEL using the tag column and assign the format to the tag column.
Next time, we will see how sorting your cells by statistic can help create a very effective display of your analysis results.