Search Results: graphs in column (120)

Data Visualization
Sanjay Matange 1
Financial graphs

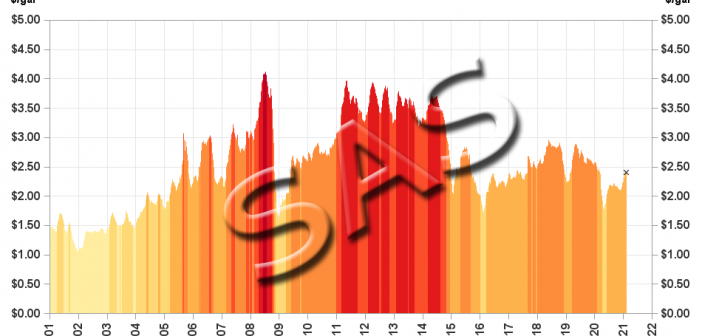
Browsing on the web, I ran into a simple but visually interesting graph of financial data.  Really, it could be any data, but this one showed up under "Financial Graphs".  I thought this would give me an opportunity to speak about an interesting new feature added to SERIES plot with

Data Visualization
Sanjay Matange 1
Clinical Graphs: A1c Plot

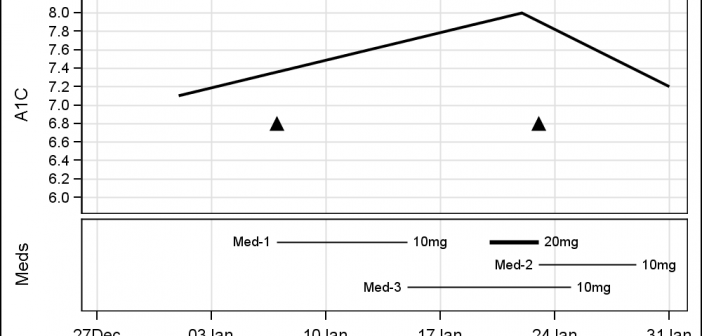
Last week I was visiting San Diego for the SANDS conference.  I always enjoy this conference as I get to interact closely with the users to hear of their pains and innovative solutions to creating Clinical Graphs. In the conference Ed Barber asked about displaying A1c data along with some

1 2 3 12