Search Results: stacked (138)

Rick Wicklin 0
Comparing two groups? Two tips that make a difference

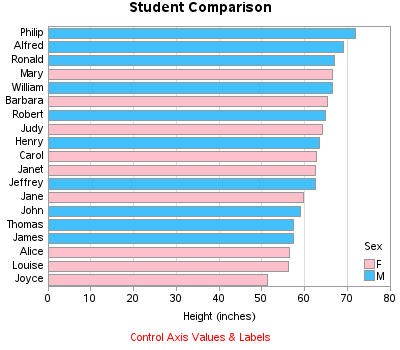
A common visualization is to compare characteristics of two groups. This article emphasizes two tips that will help make the comparison clear. First, consider graphing the differences between the groups. Second, in any plot that has a categorical axis, sort the categories by a meaningful quantity. This article is motivated

Data Visualization
Sanjay Matange 0
Doing more with nbsp

A few weeks ago I wrote an article on using the non breaking space character to prevent stripping of leading and trailing blanks in a string.   Since then, I have discovered a few more instances where the nbsp can be a useful tool for creating graphs. One such instance came up last week

Data Visualization
Sanjay Matange 0
Spark lines made easy

Spark lines, made popular by Edward Tufte, provide a way to visualize trends in a concise space, often inline with the rest of the narrative or data. Previously, I posted an article on Spark Plots in which I created different plot types, some of which included multiple graphs and data in each row.  For such

Data Visualization
Sanjay Matange 0
Broken Y-Axis

Often we want to display data as a bar chart where a few observations have large values compared to the rest.  Comparison between the smaller values becomes hard as the small bars are squeezed by the tall bars.  Here is an example data, and a bar chart showing the data. The large values

Data Visualization
Sanjay Matange 0
Dashboard graphs

In this blog we have been discussing graphs useful for analysis of data for many domains such as clinical research, forecasting and more.  SG Procedures and GTL are particularly suited for these use cases.  So, when I came upon a dashboard image from Steven Few's Visual Business Intelligence blog, showing the

Waynette Tubbs 0
SAS presenters series: Ed Hughes

In hopes of adding to your SAS Global Forum experience, we've kicked off a SAS presenters series. Here, we’ve asked some of the SAS presenters five questions to learn more about what makes them tick, why they chose to present and what they hoped you would take away from the

1 3 4 5