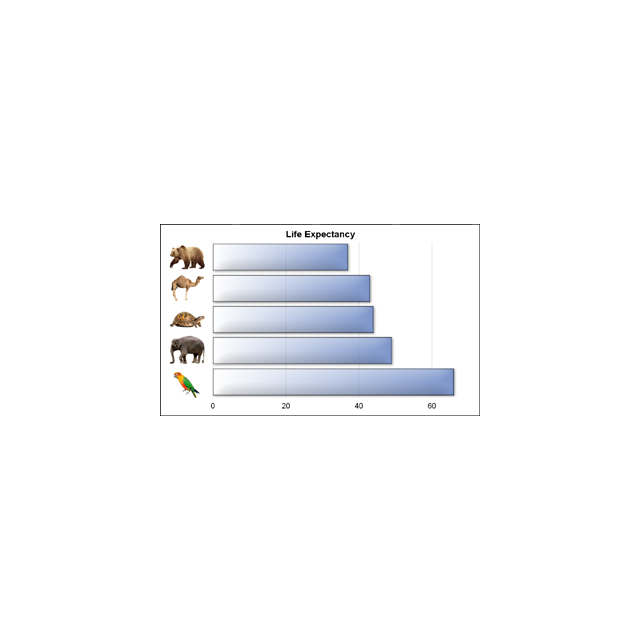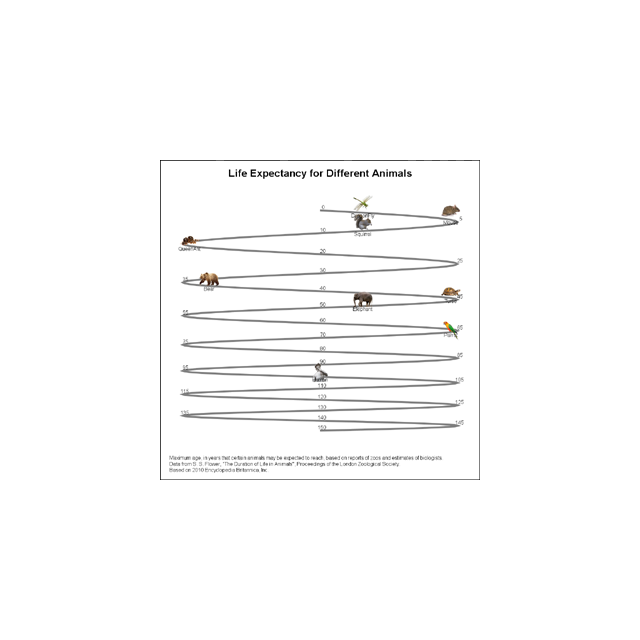
Last week I published an article on creating bar charts with visual category values. The idea was to use visual icons for the category values in a HBAR of age by animal. For the data, I referred to a visual from the 2010 Encyclopedia Britannica Inc. that I found on the
Tag: SYMBOLIMAGE
We often say a picture (or graph) is worth a thousand words. So, recursively, this could apply to other text in the graph. I thought it would be interesting to see if we can create a graph with visual categories. Another benefit is that such visual categories are inherently meaningful
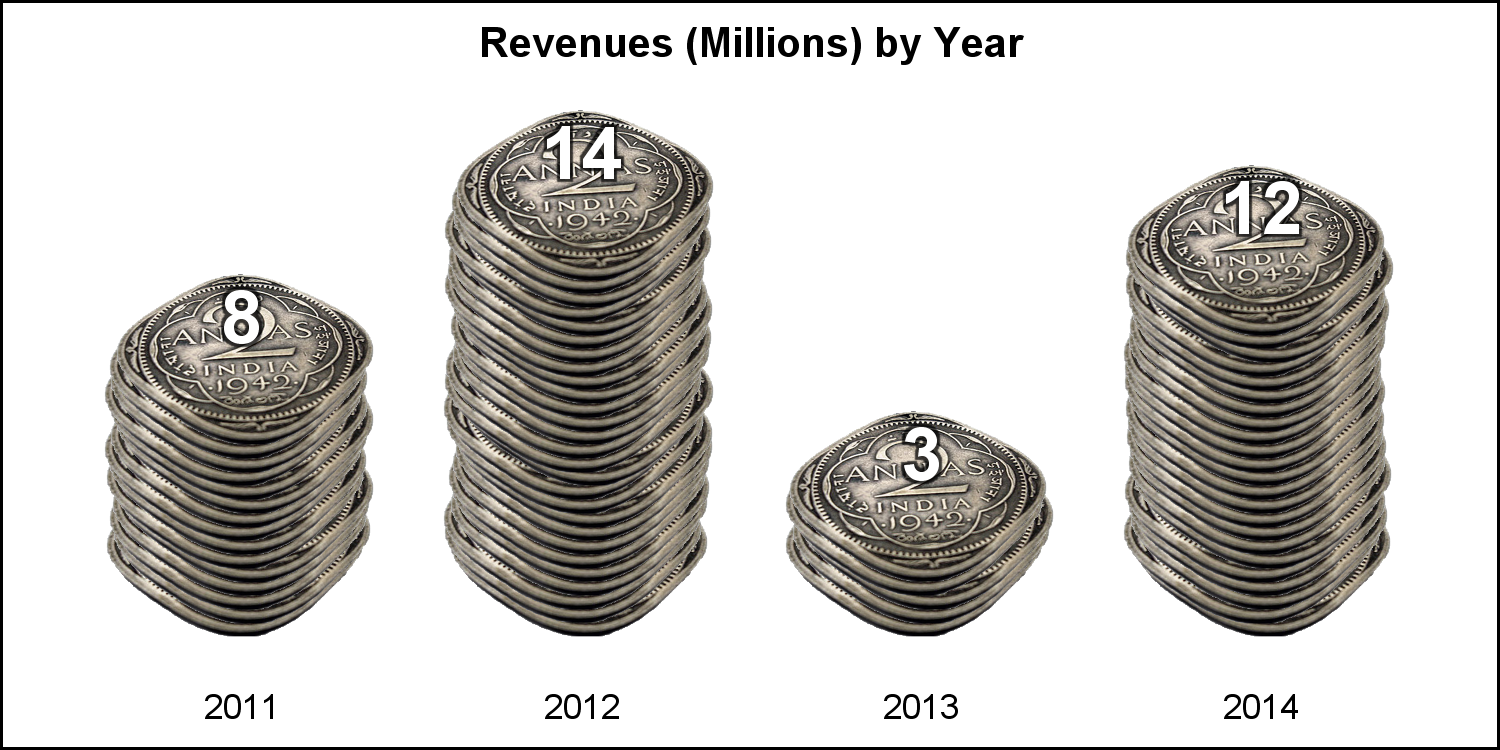
Often we see bar charts showing revenues or other related measures by a classifier using a visual of a stack of coins. Such visuals are not strictly for the purposes of accurate magnitude comparisons, but more for providing an interesting visual to attract the attention of the reader. In other words -
Last week I posted an article on creating Infographics using SAS. The interest shown by the SAS community in this topic came as a surprise. Also, it so happened by coincidence, a SAS users also called into Tech Support just about the same time with a query about creating Infographics type graph
Infographics are all the rage today. Open any magazine or newspaper and we see data and numbers everywhere. Often, such information is displayed by adding some graphical information to add context to the data. A couple of good examples are Communicating numeric information, and Facts about Hot Dogs. Riley Benson, our UX
There has been much discussion on the SAS Communities page on usage of different symbols in a graph. The solutioin can vary based on the SAS release. New features have been added at SAS 9.4 releases to SG Procedures and GTL that make this very easy. With SAS 9.4M1, almost any combination is
The attention of the world is now on Sochi and the Winter Games. Gold, Silver and Bronze medals are being earned by these amazing athletes, and everyone has an eye on the tally. Andre sent me a link to TRinker's R Blog, showing a graph of the current tally. Andre
Users have often expressed the need for more marker symbols. ODS Graphics supports over 30 scalable marker symbols, both filled and empty. As mentioned in an earlier article, with SAS 9.4, filled markers can now have outlines and fills, and can also have special effects. Also with SAS 9.4, now you