We often say a picture (or graph) is worth a thousand words. So, recursively, this could apply to other text in the graph. I thought it would be interesting to see if we can create a graph with visual categories. Another benefit is that such visual categories are inherently meaningful in all languages.
Here is an interesting graph I saw on the web published by Encyclopedia Britannica on life expectancy for different animals.
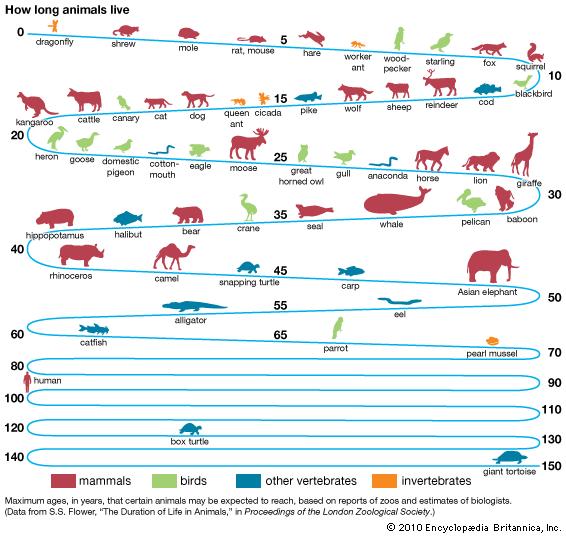
One can see the life expectancy for various animals over the timeline that is wrapped, allowing display of large variations. I used some of this data to create a traditional horizontal bar chart shown below. I did get other images that I used for the five animals. These images are included in the "Images.zip" file linked below.
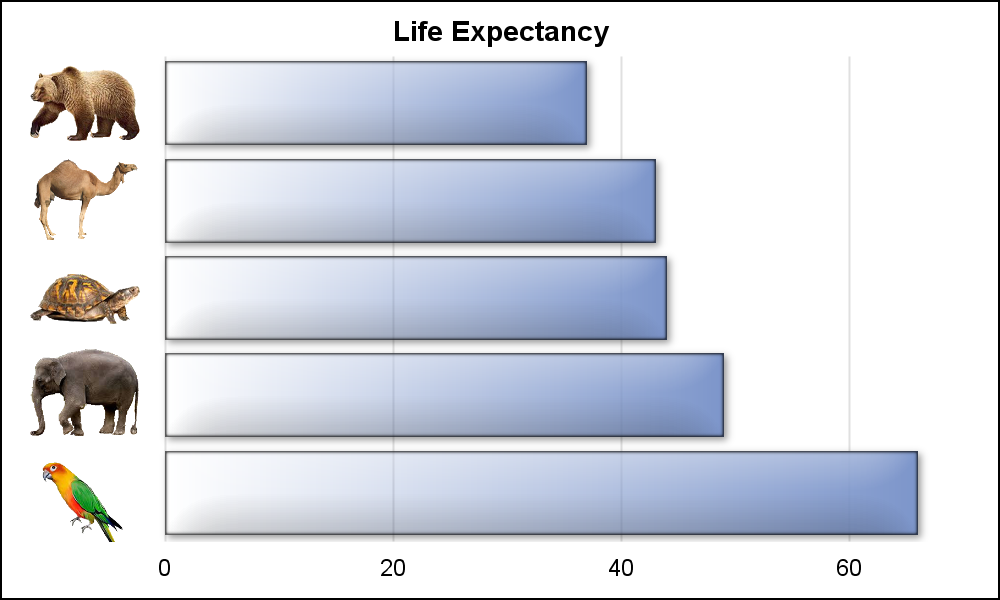
I used the same idea as in the graph on top in using pictorial representations for the categories. While I still could not get rid of the numbers on the x-axis, one could say these Arabic numerals are familiar to most people in the world. I wish I could replace the English title text with something appropriate, but did not succeed there. Suggestions are welcome.
The key feature used in the graph above is the SYMBOLIMAGE statement used to define custom symbols from image files. Then, the symbols are inserted in the list of group markers and rendered using a SCATTER plot of the SGPLOT procedure.
title 'Life Expectancy';
proc sgplot data=age nowall noborder;
/*--Define marker symbols--*/
symbolimage name=parrot image="&parrot" / voffset=-0.2;
symbolimage name=elephant image="&elephant";
symbolimage name=turtle image="&turtle";
symbolimage name=camel image="&camel";
symbolimage name=bear image="&bear";
styleattrs datasymbols=(bear camel turtle elephant parrot);
scatter x=ximg y=name / group=name markerattrs=(size=60);
hbarparm category=name response=age / baselineattrs=(thickness=0)
dataskin=matte filltype=gradient fillattrs=graphdata1;
xaxis display=(nolabel noline noticks) grid offsetmin=0.07 offsetmax=0.07;
yaxis fitpolicy=none discreteorder=data display=none offsetmin=0.1 offsetmax=0.1;
run;
Full SAS 9.4m2 Code: Pictorial_Categories
Zip File of images (copy the images in this zip file to "C:\" folder): Images


15 Comments
Love the use of images for the categorical y axis - very cool...
I do like the condensed information-rich flow of the Encyclopedia Brittanica image... its an eye-catching way to render lots of categorical data in a small space.
I agree. The Encyclopedia Britannica image makes efficient use of the available space to show 56 different values. An HBar with 56 categories is doable, and will provide good magnitude comparison. However, the large value for the "Giant Tortoise (150 years) could squeeze the small values, and then we will need a split axis. I did not know a Parrot lives that long. :-).
I was trying to think how all the information could be represented alternatively - perhaps 4 charts with each animal type but then you loose being able to compare them together. I'd be interested to see what you come up with... 😉
The information is interesting and I wonder if the ages are still the same today - 7 years on... I was impressive by the longevity of the Queen ant!!!
Right. 16 years? wow!
This is a terrific visual display. National Pet Day just passed by a couple of days ago and a while it was a great chance to spoil our dogs, I can easily see that parrot owners have the opportunity for a much longer friendship. Keep up the great work!
I'm wondering if there is a math function, possibly something for oscillation with a decay, that would let you do that line for the graph. Of course, the fun part would be figuring out how to get the animals/tick marks on it!
I found some images; it looks like you'd need to rotate those kinds of graph 90 degrees clockwise and adjust the axes and labels to make it work.
We all would love to see what you have come up with.
You could use a SERIES plot to depict the wrapped timeline, and you could use markers along the line to display each animal using a SymbolImage to display each animal image. I think it should be possible to create such a graph using SGPLOT.
Wow, this is great. I did something with annotate on an SGPLOT (inspired by Dan Heath) but this is much better and does not require as much pre-processing to get the annotate images at the right level. I too am excited about what BJ Mattson comes up with. Not that the pressure is on or anything!
I always favor plot statements over Annotate. It is much easier to get things to line up. That "Layering" method also scales to other data easily.
Just my preference. I know other users are adept at annotate and use it extensively.
It also occurs to me that it would be neat to be able to attach a sound clip, like the name of the animal, for accessibility. I'm still pretty blown away by the sonification of sg graphs!
Interesting idea. Without doubt, Ed's demo was very exciting. I know they have other tricks up their sleeves for accessibility.
Pingback: Animal life expectancy graph - Graphically Speaking
I like the possibilities of using glyphs, but I am not a fan of the Encyclopedia Britannica graph, which violates some fundamental pricipals of data visualization.
1. The vertical axis is nonlinear, but it doesn't appear to be a standard transformation. It is close to being base log2 (maybe?), but not quite.
2. The EB graph appears to show "maximum life span," not "life expectancy," which is the average life span. The average life expectancy of a human (in 2014) is about 71 years, but the graph shows humans at 99 years. The average life expectancy of a box turtle (according to Wikipedia) is 50 years, but "a significant portion lives over 100 years."
3. The turtle graphic that you use in the bar chart is a box turtle, not a snapping turtle.
On the other hand, I did not know that box turtles lived so long, so I learned something!