There has been much discussion on the SAS Communities page on usage of different symbols in a graph. The solutioin can vary based on the SAS release. New features have been added at SAS 9.4 releases to SG Procedures and GTL that make this very easy. With SAS 9.4M1, almost any combination is possible.
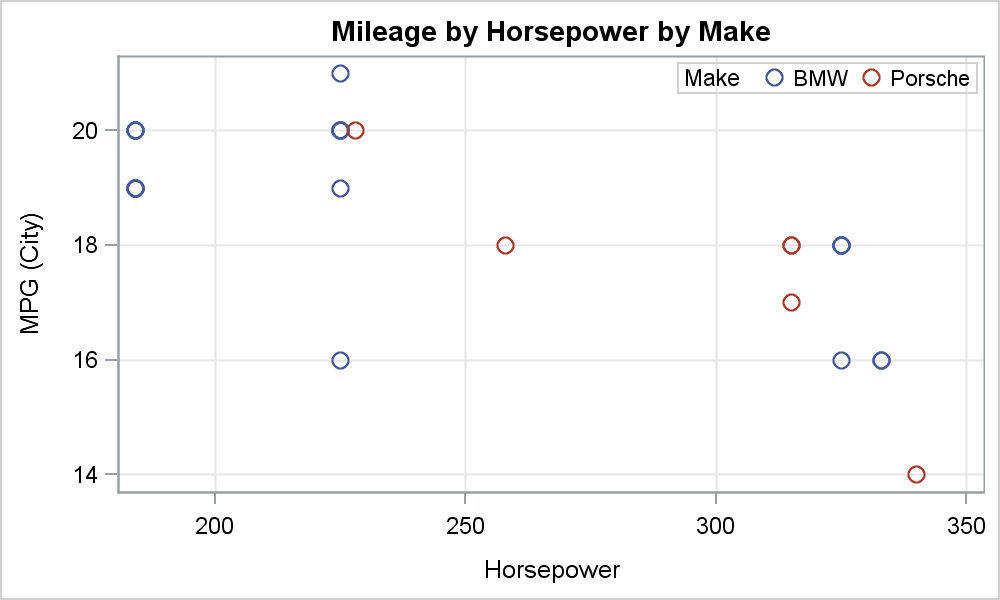 The user has a relative simple scatter plot with two class levels. The graph on the right is easily created using a scatter plot with a group role. The code is shown below.
Note, starting with SAS 9.3, ODS HTML is the default open destination, using the HTMLBlue style. This is a "Color" priority style, where each group gets only a color change till all Style Elements are used. So, you do not see varying marker symbols in the graph on the right.
title 'Mileage by Horsepower by Make'; proc sgplot data=cars; scatter x=horsepower y=mpg_city / group=make; keylegend / location=inside position=topright; yaxis grid integer; xaxis grid; run; |
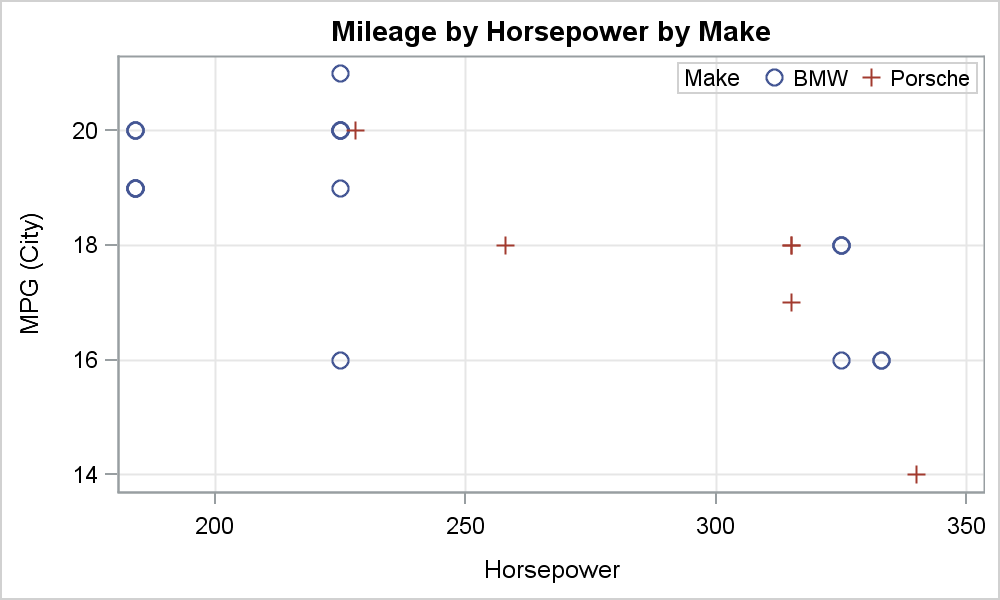 You can run the same graph with a style like LISTING, or set ATTRPRIORITY=none in the ODS Graphics statement to get the graph on the right. Now, each group gets a different color and a different marker symbol. These come from the style GraphData1-12 elements.
ods graphics / reset attrpriority=none;
The user wanted to use the symbols "X" and "Y" instead of the "circle" and "plus" symbols that are the default first two symbols in the GraphData1-12 elements list. This in itself is very easy, since the "X" and "Y" symbols are included in the list of built-in symbols supported by these procedures. All you need to do is change the default symbols in the GraphData1-12 elements.
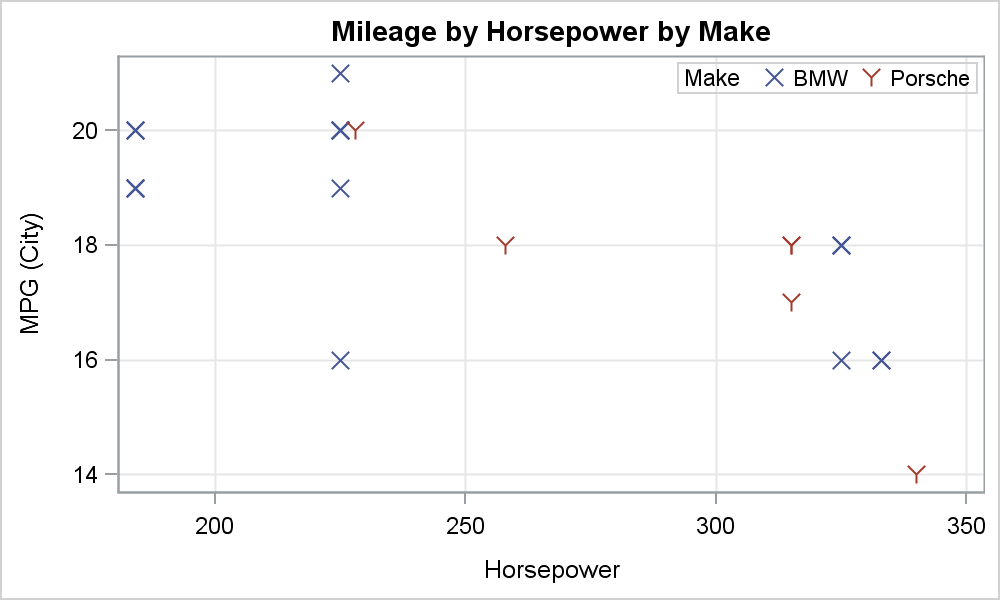 With SAS 9.4, it is very easy to change the group attributes by using the STYLEATTRS statement in SGPLOT. This feature provides a simple in-line way to modify the list of color, contrast color, symbols and line patterns used for the group values, as shown in the code snippet below.
The list of values provided REPLACE the default group list as if this came from the style. So, now the group cycling uses only the two symbols "X" and "Y" provided in the list.
proc sgplot data=cars; styleattrs datasymbols=(X Y); scatter x=horsepower y=mpg_city / group=make; run; |
But what if you want to use some special symbols that are not provided in the built-in list of symbols? You can do that with SAS9.4M1 using the new statements SYBMOLCHAR and SYMBOLIMAGE. SymbolChar statement supports the ability to use any character from any font as a symbol. Using a Unicode font allows you thousands of symbols that can be used.
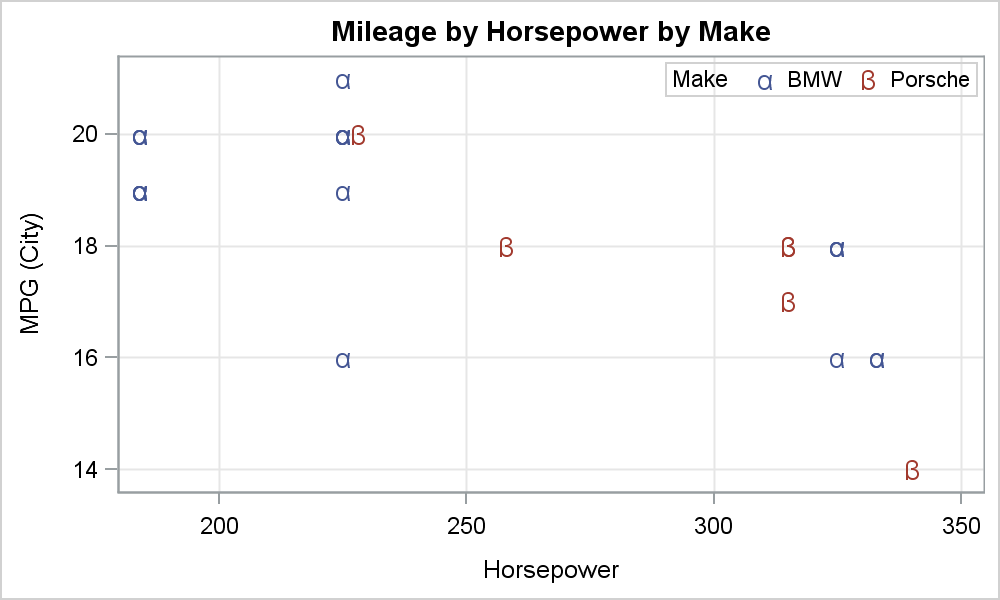 Say you want to use the greek symbols for "Alpha" and "Beta" as the marker symbols. You can define a new symbol name using the SYMBOLCHAR statement and then include that in the list of group symbols to be used using the STYLEATTRS statement. The code snippet is shown below, and the resulting graph is shown on the right. Click on graph for a higher resolution view.
proc sgplot data=cars; symbolchar name=Alpha char='03b1'x / scale=1.8; symbolchar name=Beta char='03b2'x / scale=1.8; styleattrs datasymbols=(Alpha Beta); scatter x=horsepower y=mpg_city / group=make markerattrs=(size=9); run; |
Note the use of the SCALE option above. Most font glyphs do not occupy all the pixels in the glyph. So, these symbols may appear small. The scale options allows us to scale them up.
 And now, the "pièce de résistance". In many cases, such as the case here, we can use symbols that not only distinguish between the group values, but by themselves provide information on what they represent.
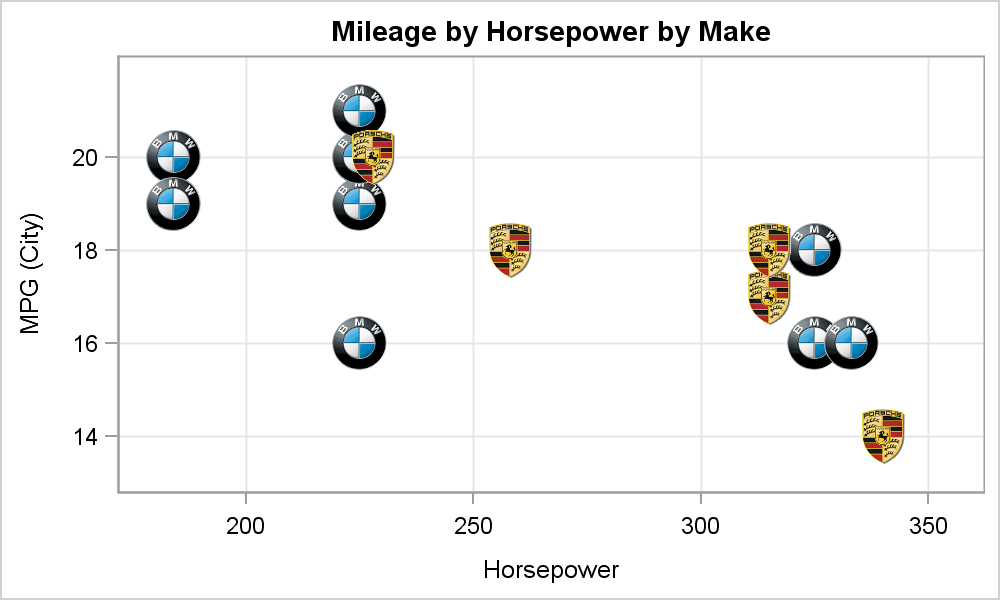
The SYMBOLIMAGE statement allows you to define new symbols from images. These can then be used for group values using the STYLEATTRS statement, just like shown above. Here is a graph using image symbols. Note, I have removed the legend just to make this point. The markers do not require any legend to explain what they stand for (for most users).
It helps to make the images have a transparent background, so the shape of the icon is visible, and does not block other markers. The images must be available on the local file system.
proc sgplot data=cars noautolegend; symbolimage name=BMW image="C:\BMWTrans.png"; symbolimage name=Porsche image="C:\PorscheTrans.png"; styleattrs datasymbols=(BMW Porsche); scatter x=horsepower y=mpg_city / group=make; run; |
Full SAS 9.4 Code: Symbol


4 Comments
Nice. Is there a way to associate the group variable "make" with the names of the symbol files in a dataset and then pass that to the graph? The solution you show seems very script-based. Data-driven solutions scale and automate better.
The association between the symbol and the values is through the GROUP=make option:
scatter x=horsepower y=mpg_city / group=make;
Only the definition of the special symbols is what you call "Script based".
Where can I find a list of hex codes for characters in SAS?
... I found part of it: http://v8doc.sas.com/sashtml/gref/z3epts.htm
Not sure whether this proper place to ask this question:
why when I use this syntax in sgpanel (I am using LSAF SAS9.4):
symbolchar name=sym1 char='2014'x ;
scatter x=avisitn y=mean / markerattrs=(symbol=sym1 size=10pt color=black) name="med";
I am not getting all datapoints right (half is visible, half is missing)
but when I use normal symbol=plus(commenting symbolchar statement)
scatter x=avisitn y=mean / markerattrs=(symbol=plus size=10pt color=black) name="med";