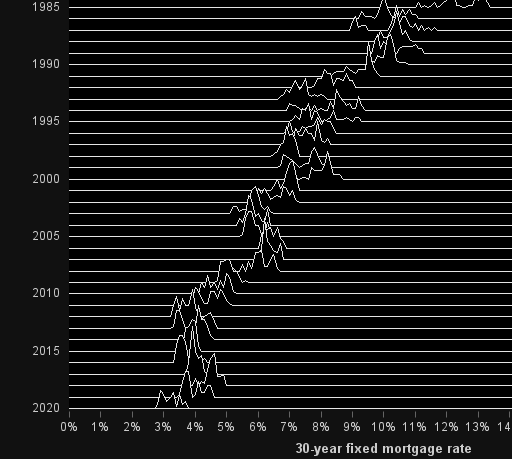
When it comes to plotting mortgage rate data, I often look to Len Kiefer for inspiration. He recently posted a retro-looking graph on twitter that caught my eye ... and of course I had to see if I could create something similar using SAS. For lack of a better term,
Tag: black background
During the 2020 Coronavirus pandemic, you've probably formed a great appreciation for good, informative graphics. Good graphics can help you get a handle on thousands of individual data values, see the geographical distribution, or look for trends. In February, I wrote a blog post about creating a coronavirus dashboard with
The COVID-19 Coronavirus outbreak has been in the news a lot lately, and everyone is probably looking for a quick/easy way to see the data. The best visualization I've seen so far is this dashboard by Johns Hopkins. Here's a screen-capture: But before we dive into the data analysis, let's
The English language can be a bit tough to learn. One reason is that sometimes words can have more than one meaning. For example, the word shady can mean "of doubtful honesty or legality," or it can mean "giving shade from sunlight." Which of those meanings am I thinking about,
Do you remember The Matrix movies, that started coming out in 1999? Hopefully this movie franchise didn't give you a fear of virtual reality and AI. The thing I remember most from the movie was the really cool slow-motion video effects (from multiple angles) in the fight scenes. And the
Information Dashboards were the hot topic a few years ago, but the hype seems to have died down lately. A good dashboard is still a very useful way to summarize, analyze, and share data - so I thought I'd re-visit the topic, and try to improve an old dashboard. Did
As a kid who grew up in the 60s & 70s, I was a big fan of the original Star Trek TV series. And in the years since, I have seen lots of the Star Trek “technology” become a reality: cellphones, portable tablet computers, talking computers (Alexa/Siri), etc. But I
If you're into 1980s pop music, then I bet you love Billy Joel's song We Didn't Start the Fire. But do you know every word, and the significance of every reference? Let's use SAS software to create an interactive visualization that will help you fully understand this song! I first saw
This blog post discusses the use of a black background in a graph. But before we get started, I invite you to have a listen to one of my favorite songs - "Paint it Black" by the Rolling Stones. Perhaps this song subliminally persuaded people to use black backgrounds in
The best graphs are both beautiful and informative - a smooth blend of art and analytics. But more often than not, the two collide rather than blending smoothly... Here is a link to a artistic infographic I recently saw posted by Vendavo on twitter. Their message (80% of your profit is generated
I recently read a Washington Post article about the euro versus the dollar, and I wanted to analyze the data myself to see whether the article was simply stating the facts, or "sensationalizing" things. The washingtonpost.com article started with the headline, "This is historic: The dollar will soon be worth
If you're a SAS user, chances are you're a bit of a science/technology/engineering/math nerd -- and also a fan of The Big Bang Theory. Therefore this SAS analysis on The Big Bang Theory should be right up your alley! Yesterday (September 22) was the start of the 8th season for the TV series,
With all the recent news reports about the missing Flight 370, I wondered what other airplanes have disappeared without a trace ... and I used SAS to visualize that data! There was in interesting infographic on the Bloomberg website that sort of answered my question, but their map just had
When you create maps, you are typically plotting data for analytics -- but you can also use SAS to create 'pretty' maps for background decorations (for posters, slides, presentations, etc). This blog shows you a few examples... A few years ago I noticed that the CNN Situation Room had a decorative
Everyone in the world has their attention turned towards the Olympics this week, so what better topic to tie in to a SAS/GRAPH blog than that?!?! I had seen a graph on the guardian website that I thought was interesting, so I decided to try to create my own (slightly different)