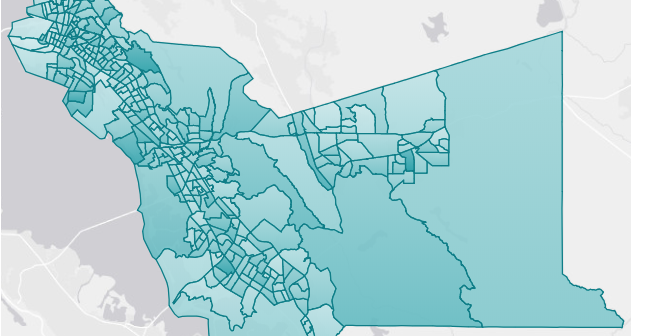
Do you work with custom polygon maps in SAS Visual Analytics? Read about a few "gotchas" to help you troubleshoot some common issues you may encounter.
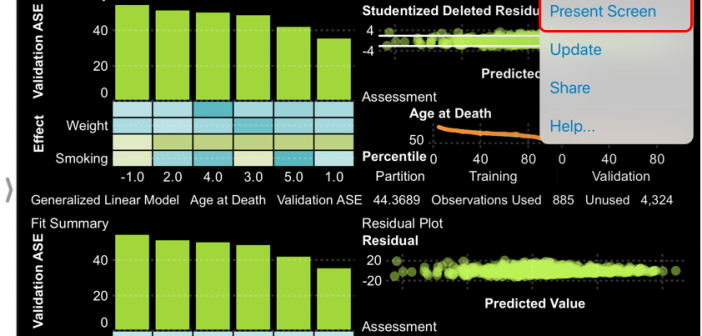
Demo SAS Visual Analytics live on your mobile device to your team across the world. Read this post for the details.
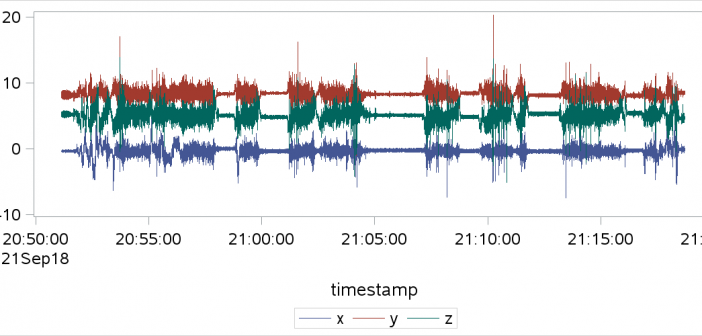
How to extract driving patterns by using smartphone sensors -- especially the accelerometer. With accelerometer readings in hand, you can use spectral analysis and other techniques to decompose events, and machine learning to match differentiate from patterns of risky drivers.
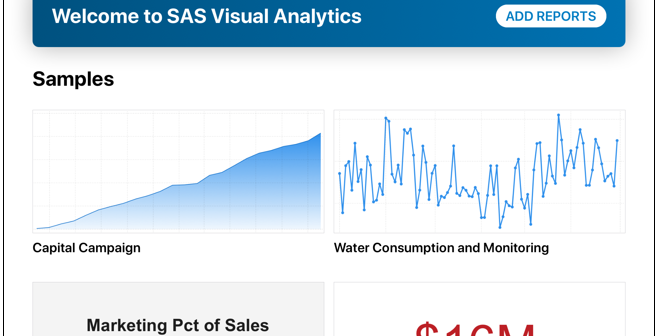
If you use SAS Visual Analytics and don’t have the SAS Visual Analytics app, you're missing out on a ton of convenience and interaction you could be having while on-the-go. This post outlines the app highlights.
Do you want to insert blank rows into your TABULATE procedure tables? Here's a SAS sample and two other methods that will get the job done.
How can you use analytics to design better biopsies and improve outcomes? This high school student has some ideas, and she presented them at Analytics Experience 2018.
This post goes through the steps to build complex models in SAS Model Studio and publish and run them to Hadoop in SAS Viya.
Learn how to create measures with different levels of aggregation through selective filtering in SAS Visual Analytics. This post illustrates selective filtering through a "Customer Penetration" example.
How can SAS Grid Manager and SAS Viya work together to process massive volumes of data? Get answers to common questions about how the two interact in this blog post.
How to count words in SAS with the COUNT functions, and concatenate strings by using the CAT functions. Use these tips to modernize your SAS code!