When was the last time you or your colleagues wanted access to data and tools to produce reports and dashboards for a business need? Probably within the last hour. Self-service BI applications – gaining popularity as we speak – make gaining insights and decision making faster. But they've also generated a greater need for governance.
Part of governance is understanding the data lifecycle or data lineage. For example, a co-worker performed some modifications to a dataset and used it to produce a report that you would like to use to help solve a business need. How can you be sure that the information in this report is accurate? How did the producer of the report calculate certain measures? From what original data set was the report based?
SAS provides many tools to help govern platforms and solutions. Let’s look at one of those tools to understand the data lifecycle: SAS Lineage Viewer.
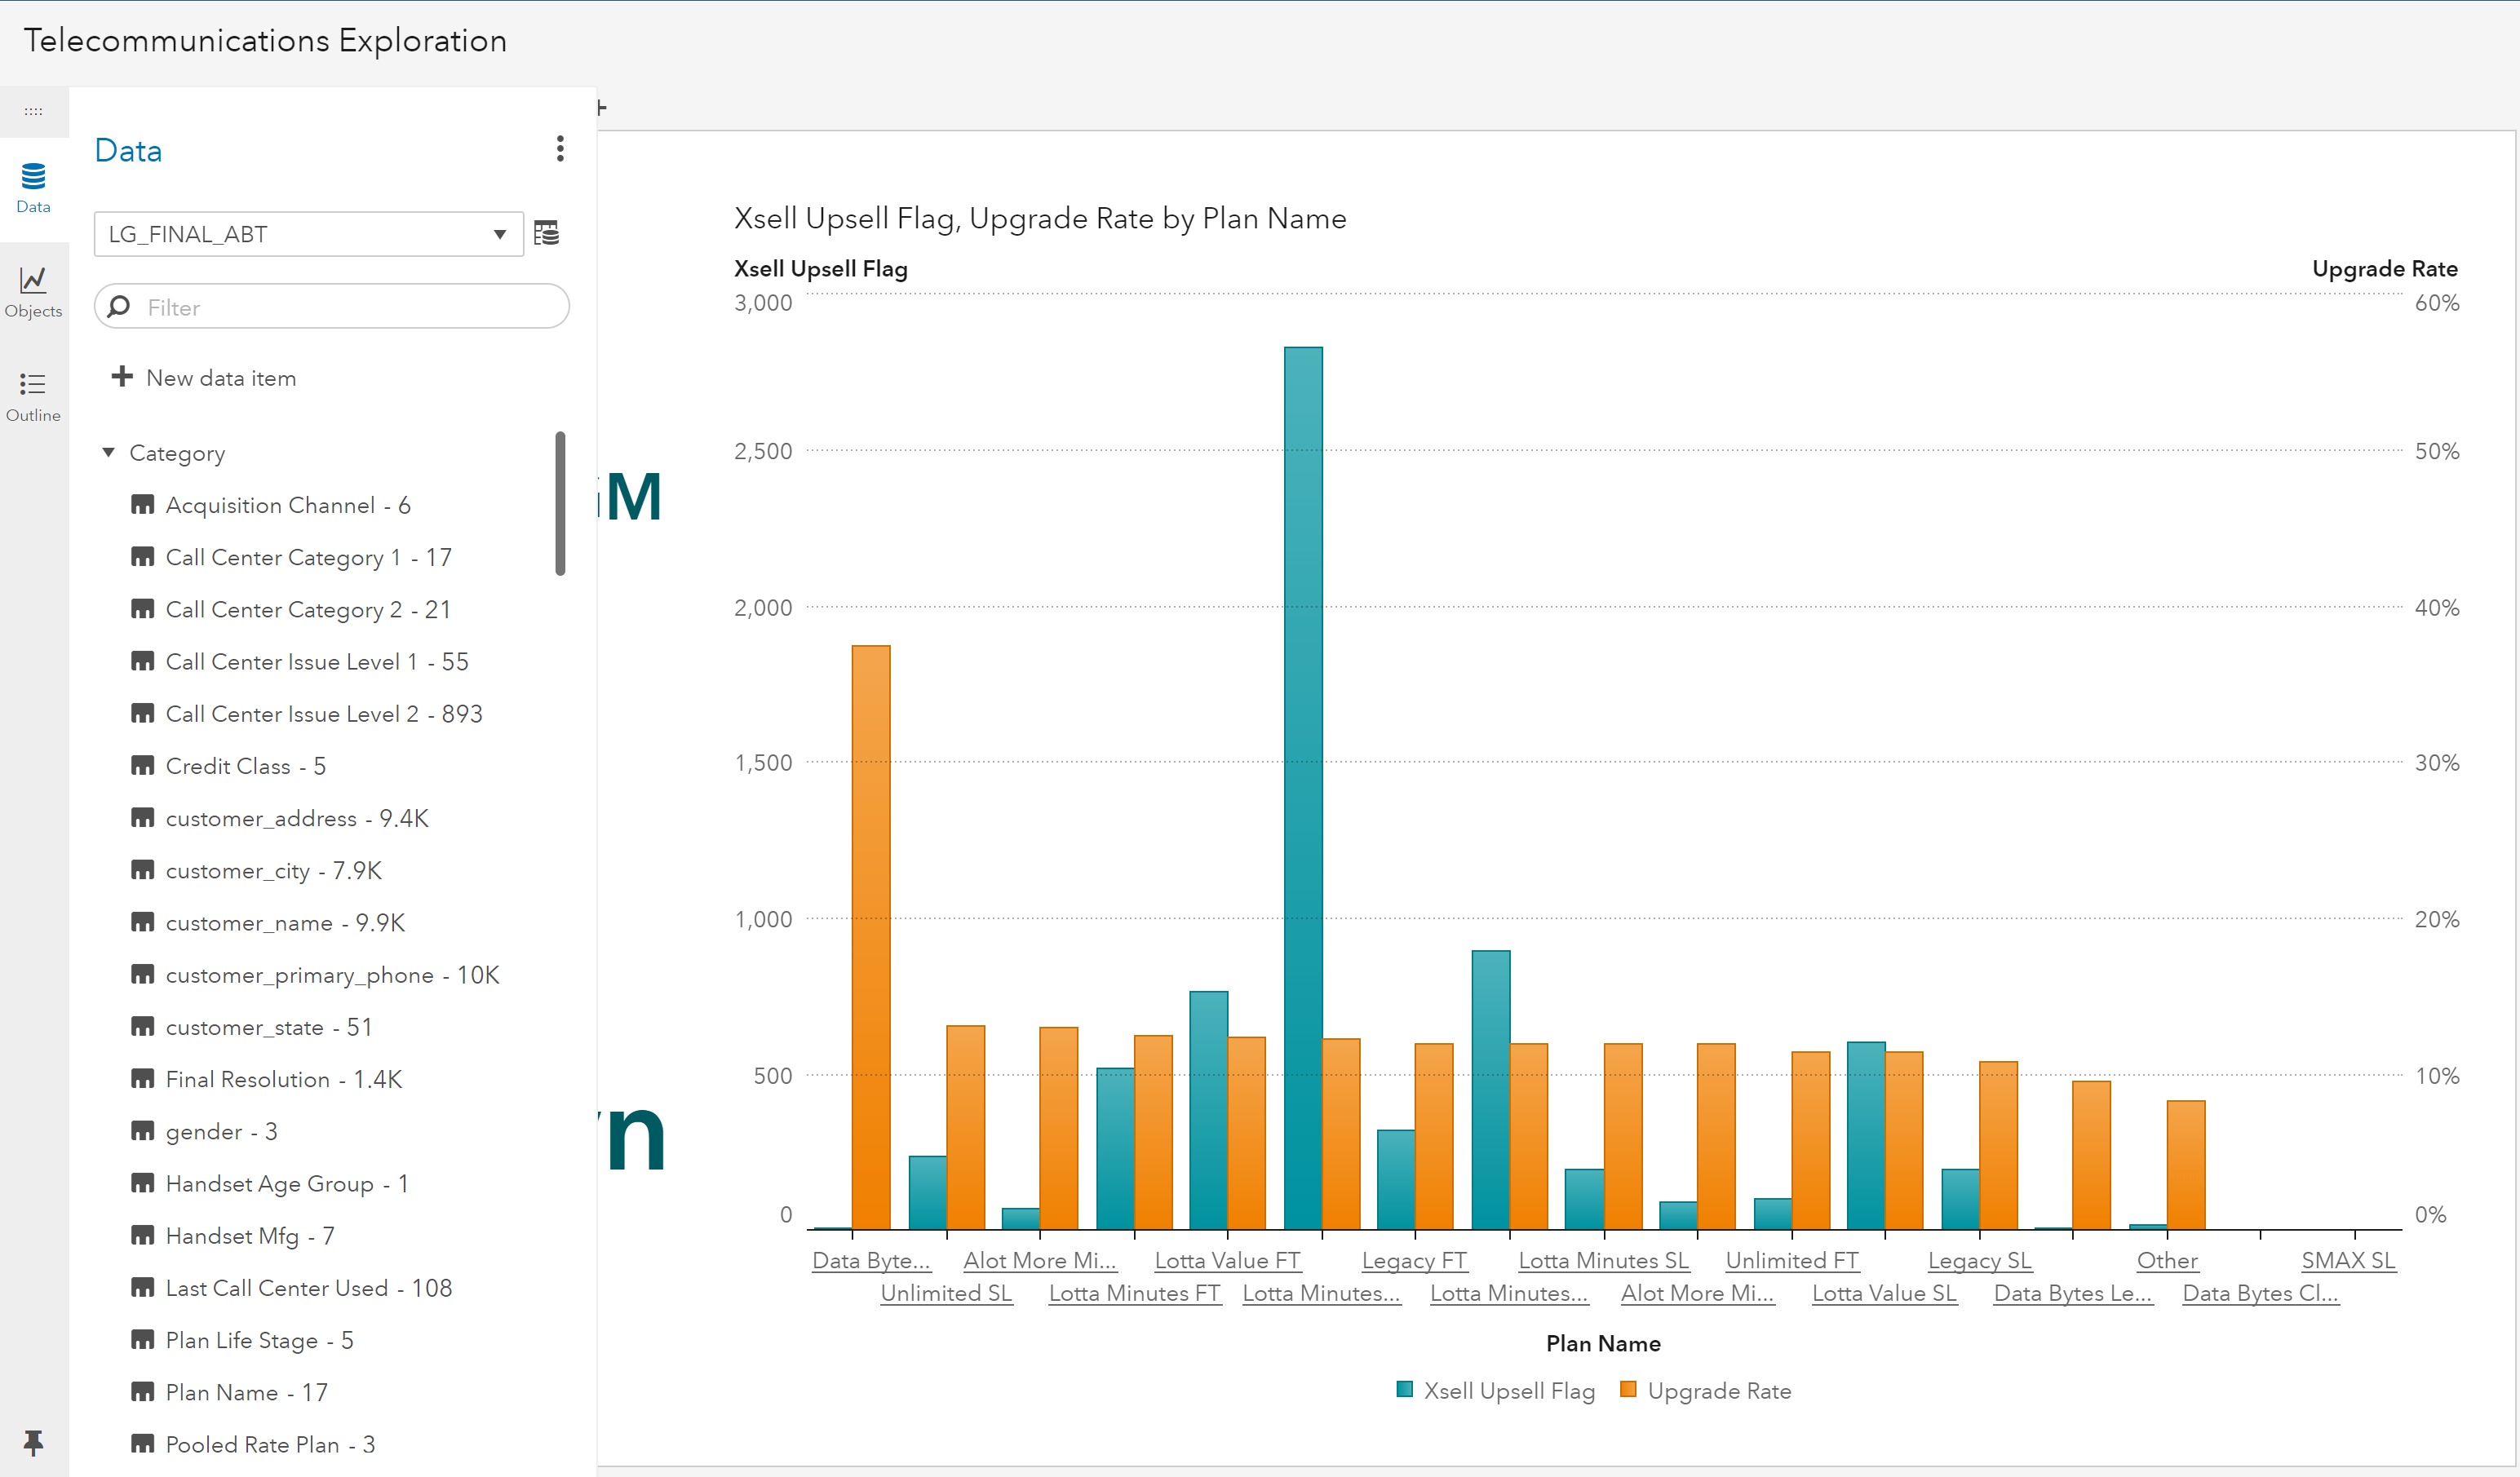
Here we have a report created to explore and visualize telecommunications data using SAS Visual Analytics. The report shows our variable of interest, cross-sell and up-sell flag, and its relationship to other variables. This report will be used to target customers for cross-sell or up-sell.
This report is based on an Analytical Base Table (ABT) that was created by joining two data sets:
- Usage information from a subset of customers who have contacted customer care centers.
- Cleansed demographics data.
The name of the joined dataset the report is based on is LG_FINAL_ABT.
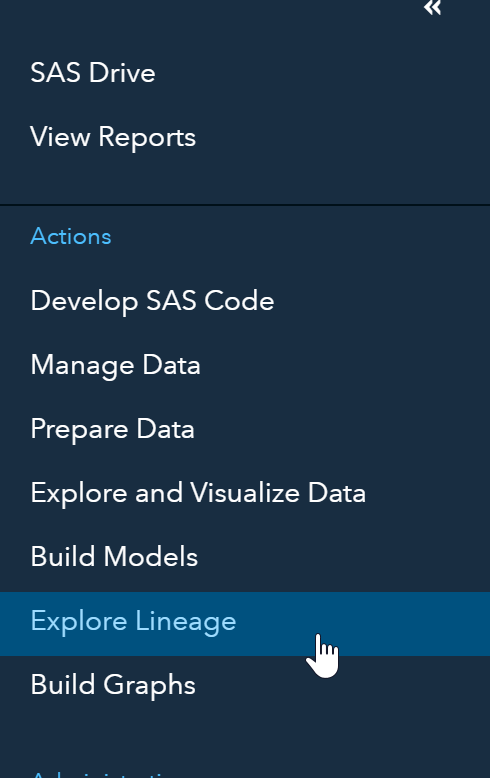
To make sure we understand the data behind this report we’ll explore it using a lineage viewer (you will need to be assigned to the "Data Management Business User” or “Data Management: Lineage” group, which an administrator can help you with). From the applications menu, select Explore Lineage.
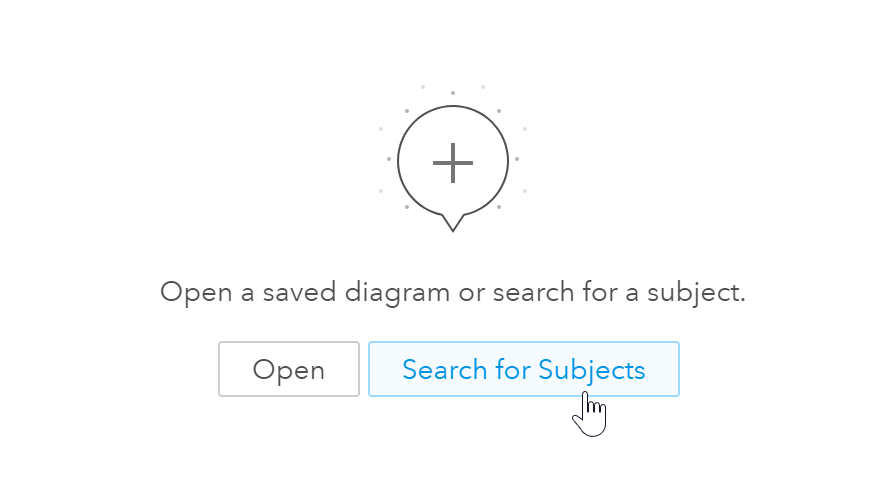
We’ll click on Search for Subjects and search for the report we were just reviewing: Telecommunications.
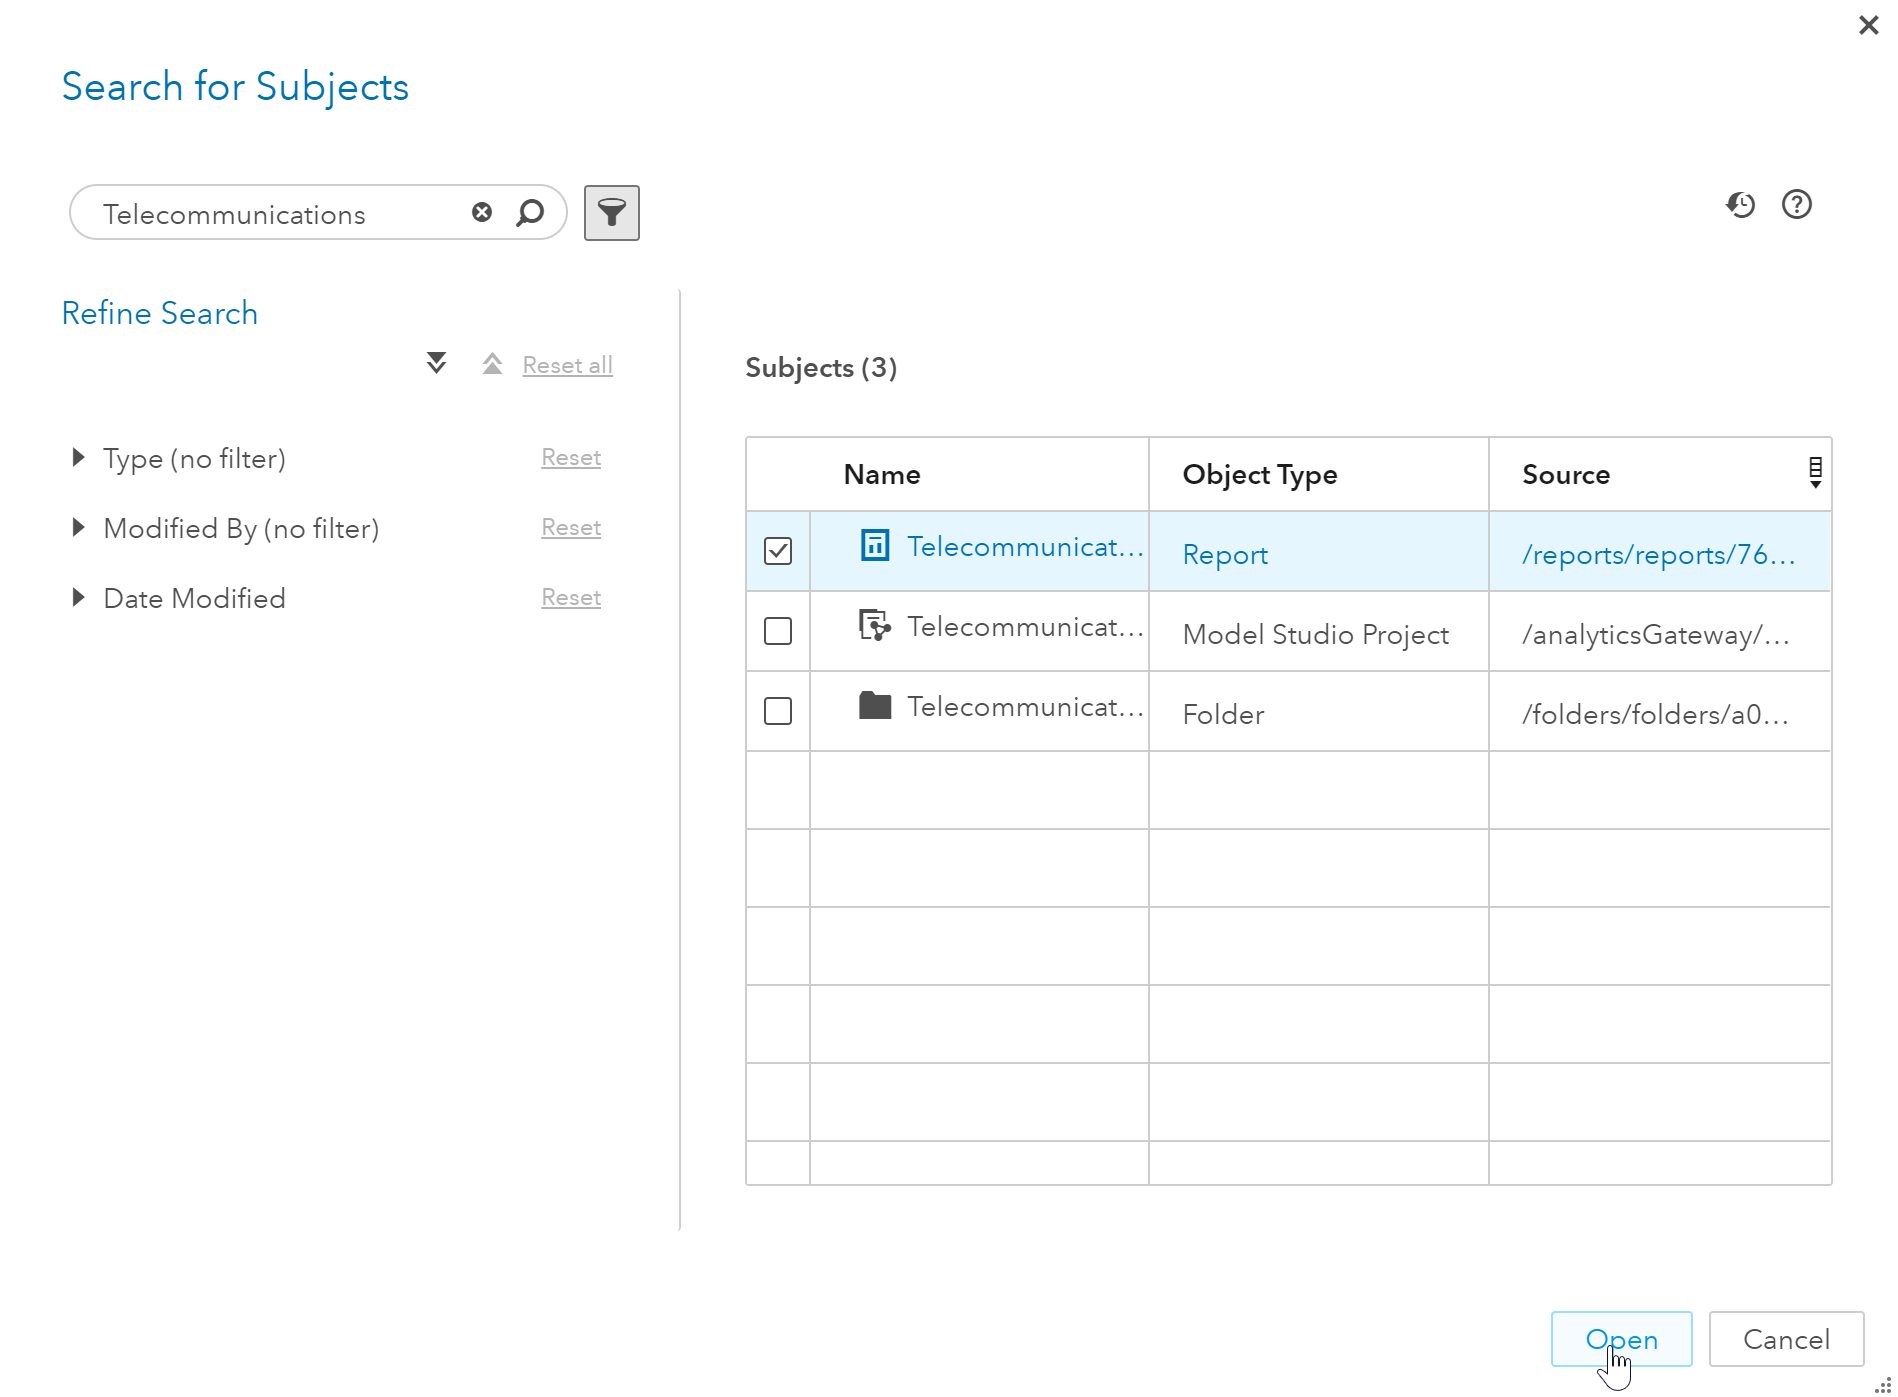
I’ll enter Telecommunications in the search field then select the Telecommunications report.
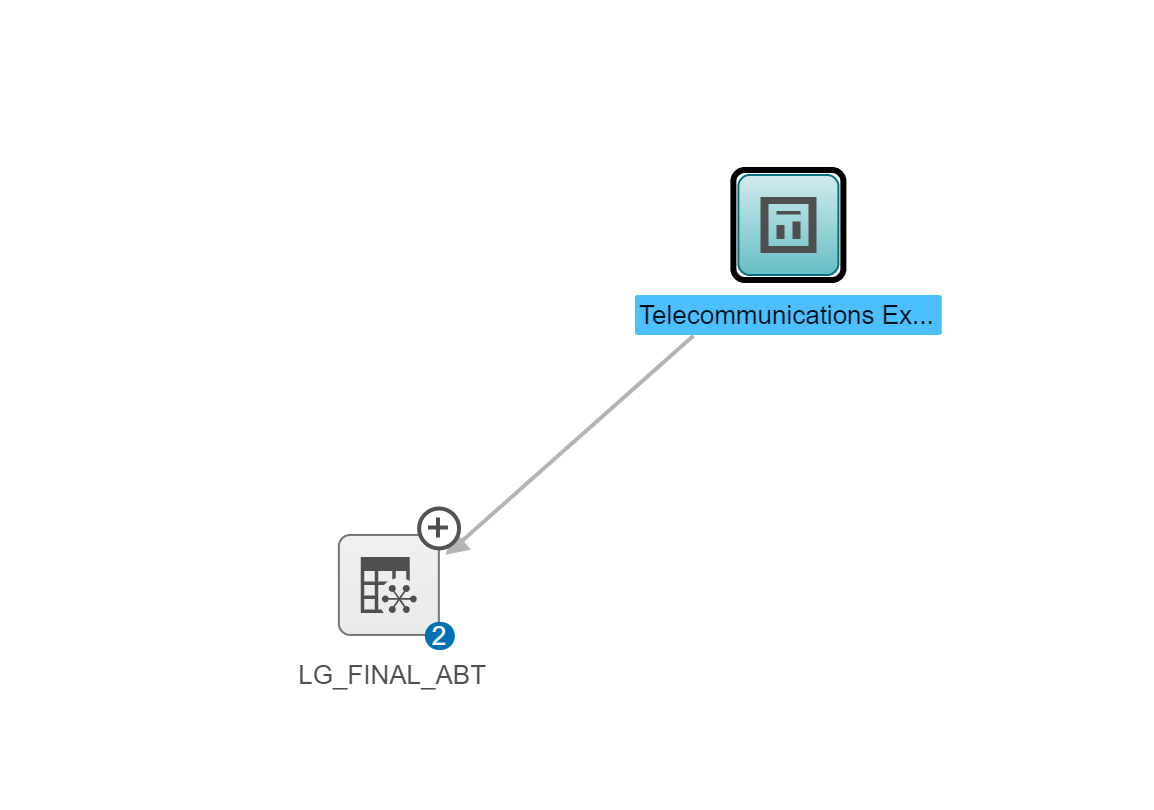
The first thing I see is the LG_Final_ABT CAS table my report is dependent on.
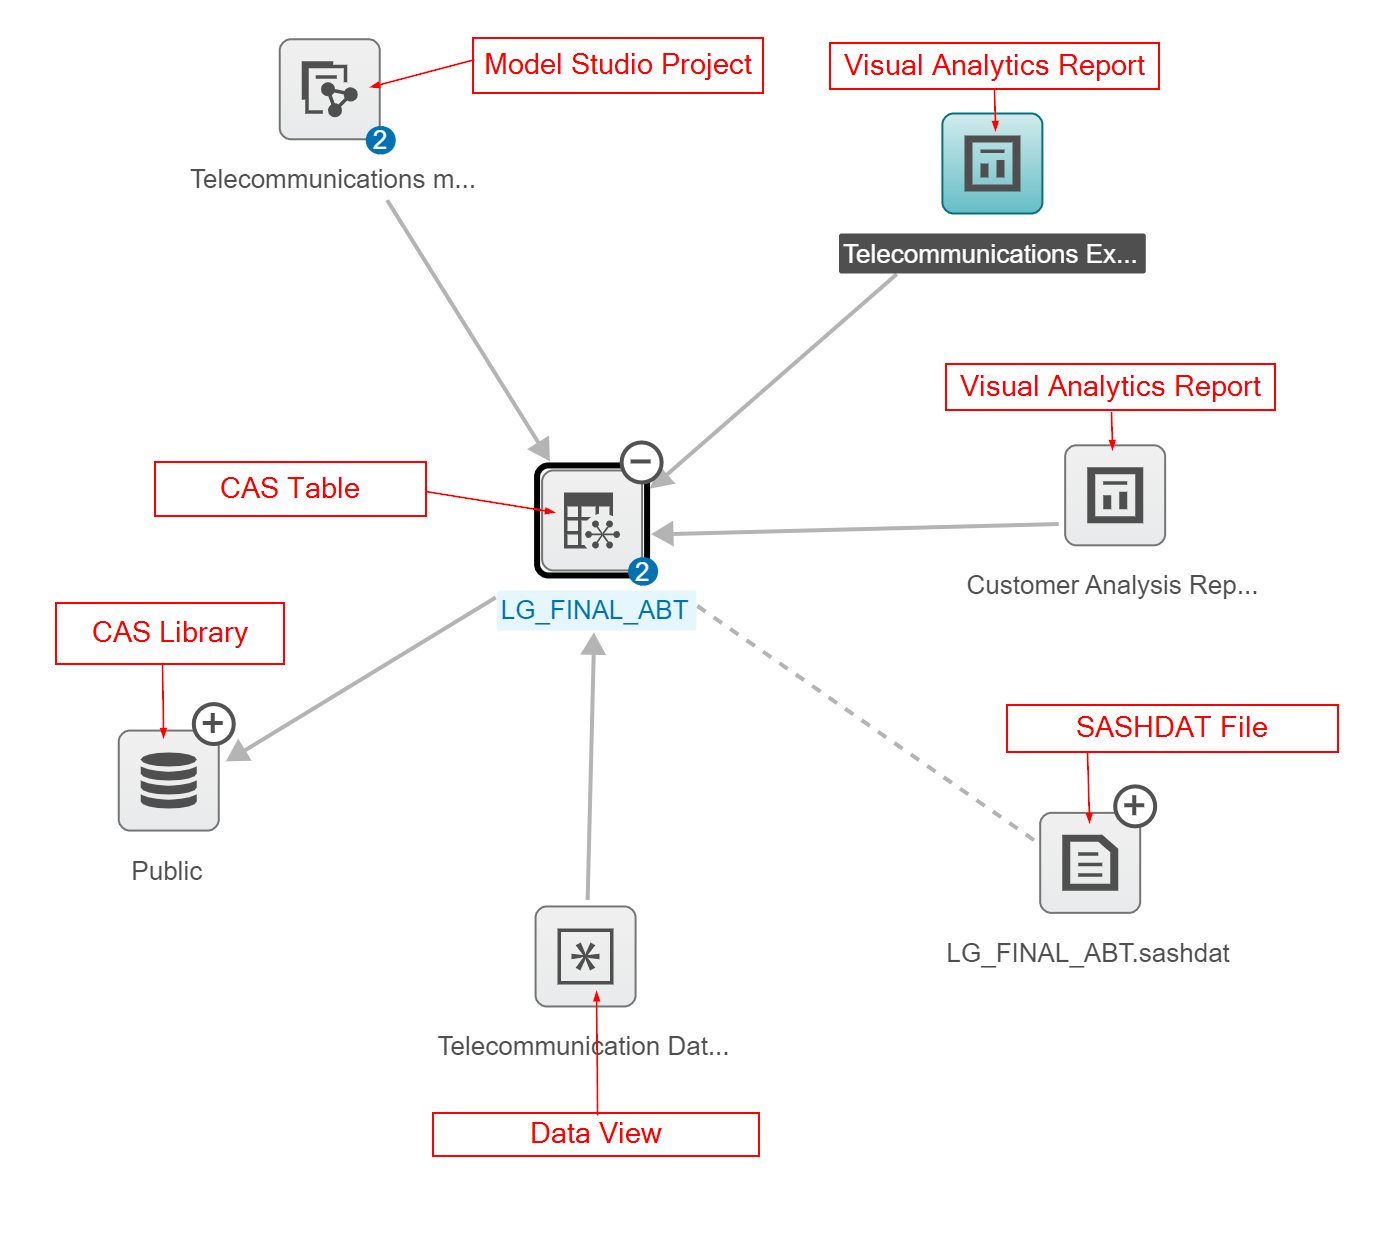
If I click on the + sign on the top right corner of the data, LG_Final_ABT, I can see all the other relationships to that CAS table. There is a Model Studio project, two Visual Analytics Reports (including the report we looked at), and a data view that are all dependent on the LG_FINAL_ABT CAS Table. This diagram also shows us that the LG_FINAL_ABT CAS table is dependent on the Public CAS library. We also see that the LG_FINAL_ABT CAS table was loaded into CAS from the LG_FINAL_ABT.sashdat file.
Let’s explore the LG_FINAL_ABT.sashdat file to see its lineage. Clicking on the + expands the view. In the following diagram, I expanded all the remaining items to see the full data lifecycle.
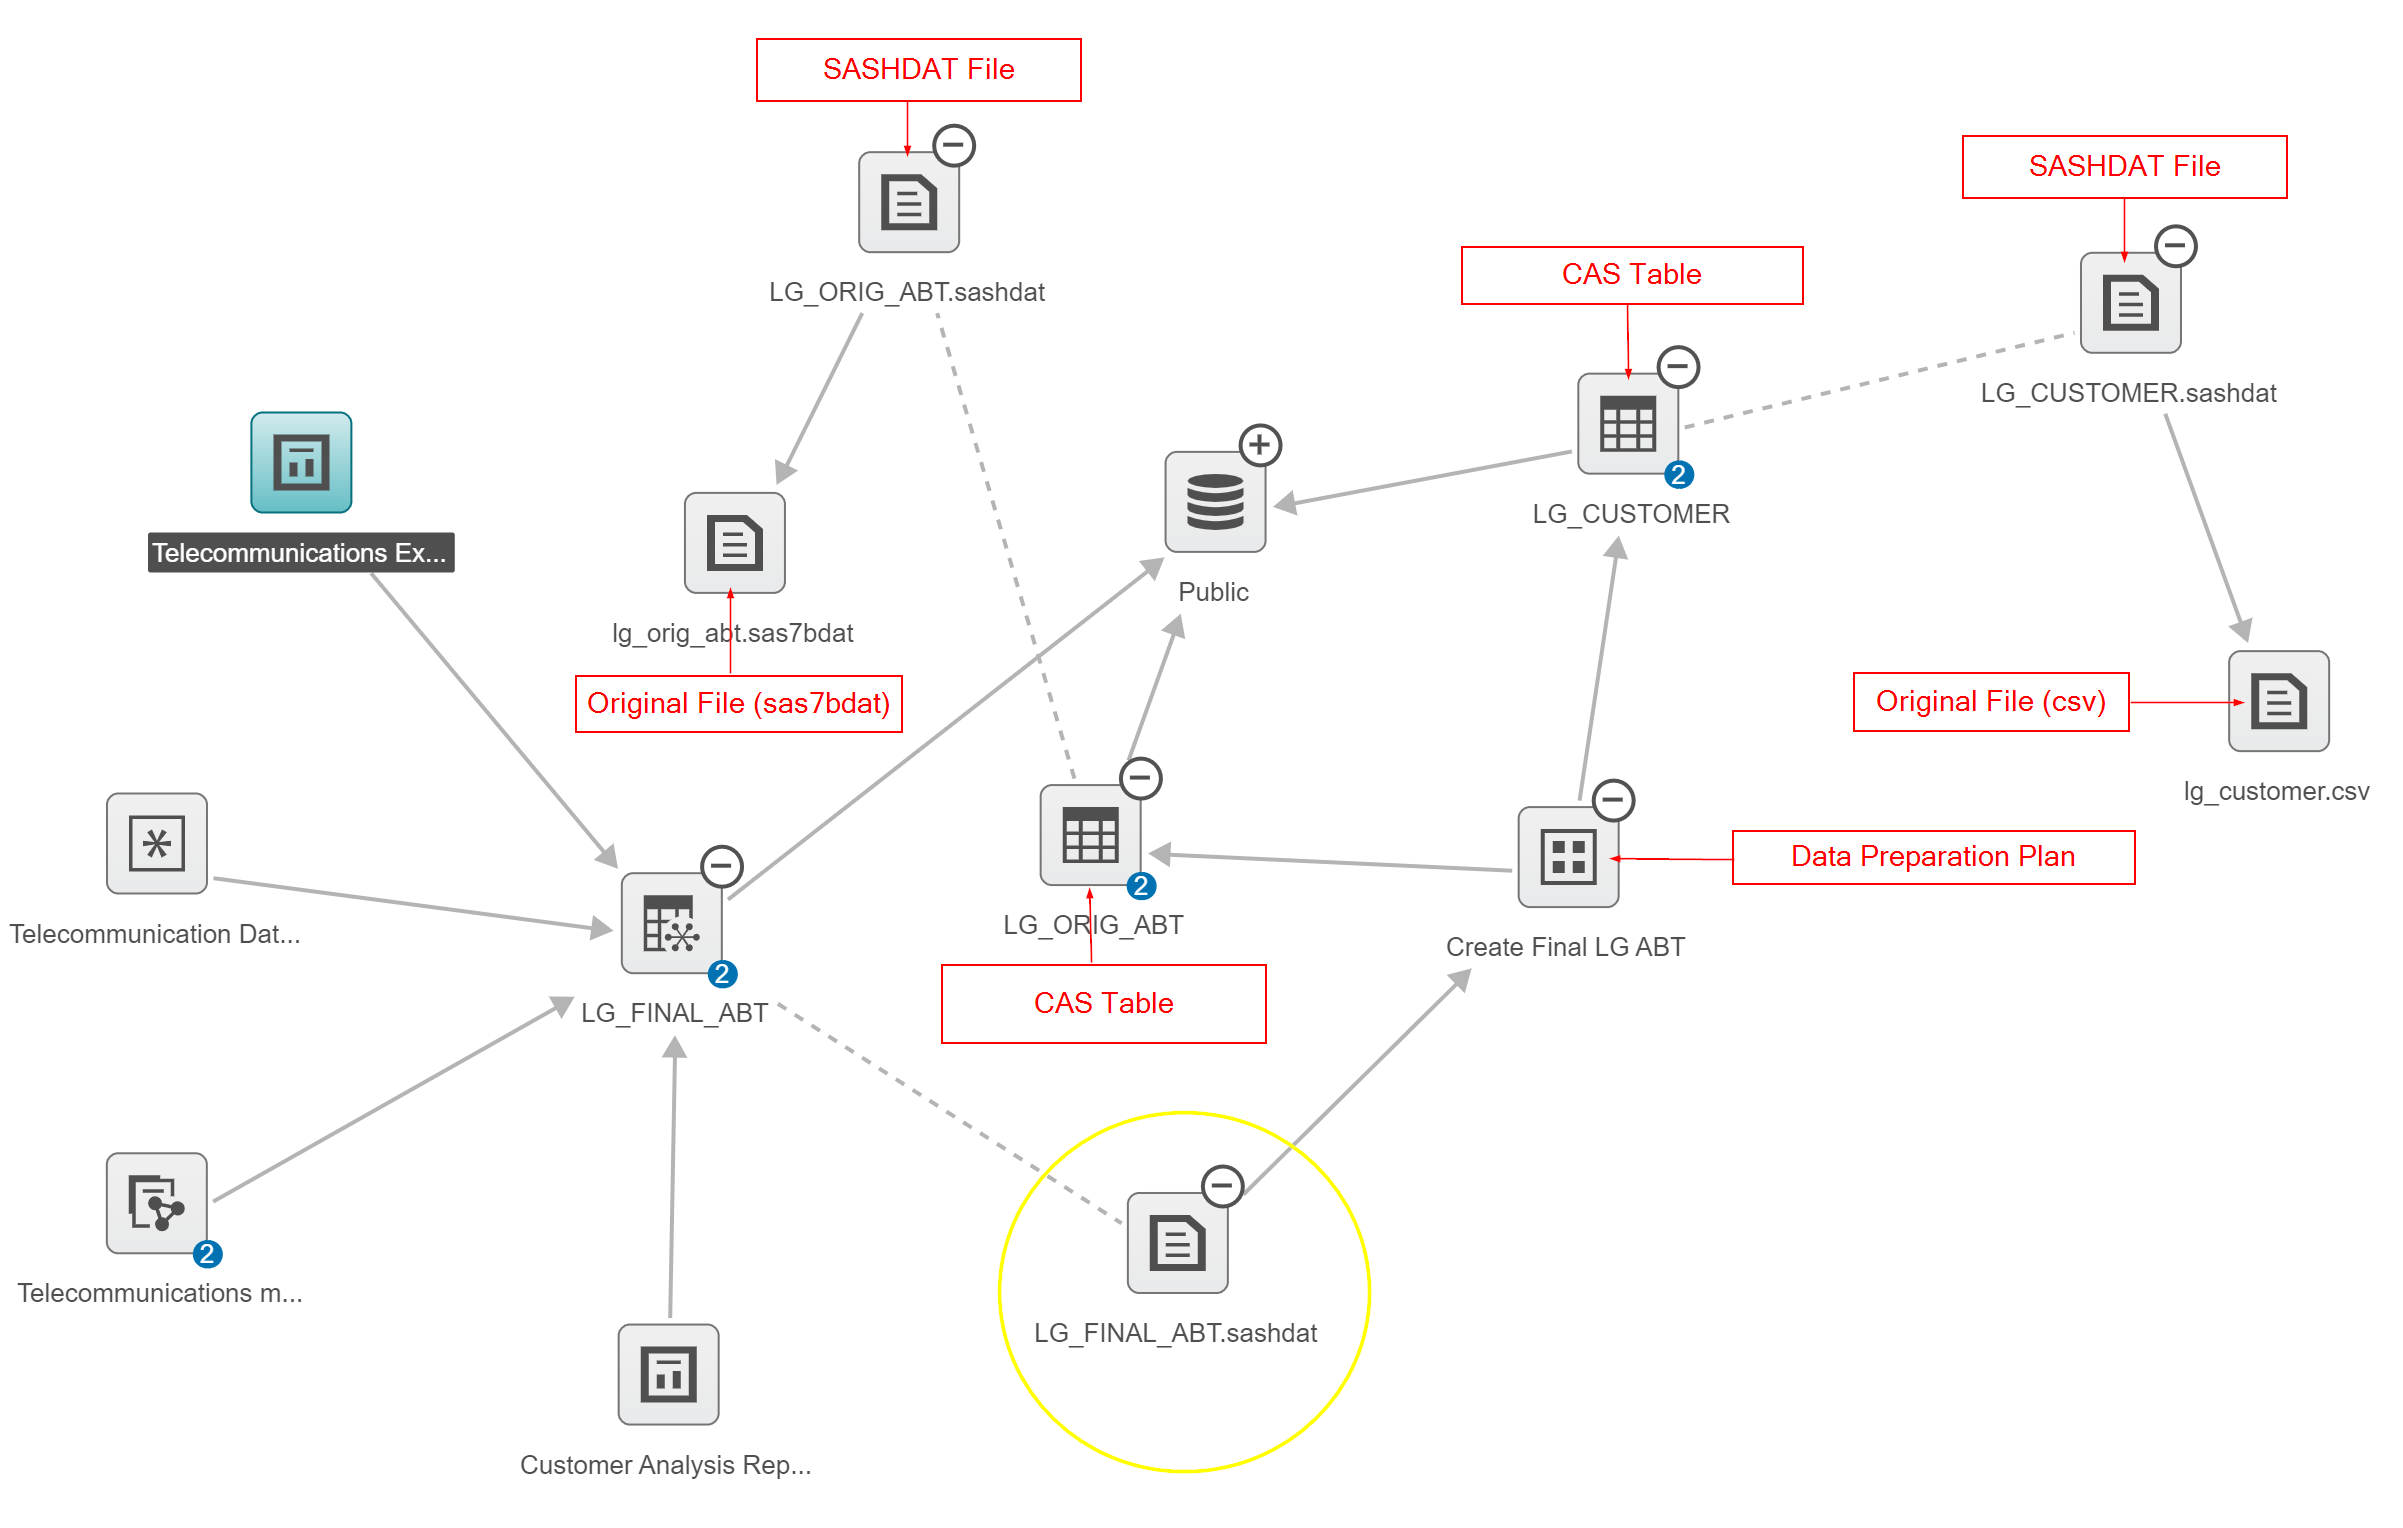
This image shows us the whole data life cycle. From LG_FINAL_ABT.sashadat we see that it is dependent on the Create Final LG ABT data preparation plan. That plan is dependent on two CAS tables; LG_CUSTOMER and LG_ORIG_ABT. The data lineage viewer shows us that the LG_CUSTOMER table was loaded in from a csv file (lg_customer.csv) and the LG_ORIG_ABT CAS file was loaded in from a sas data set (lg_orig_abt.sas7dbat).
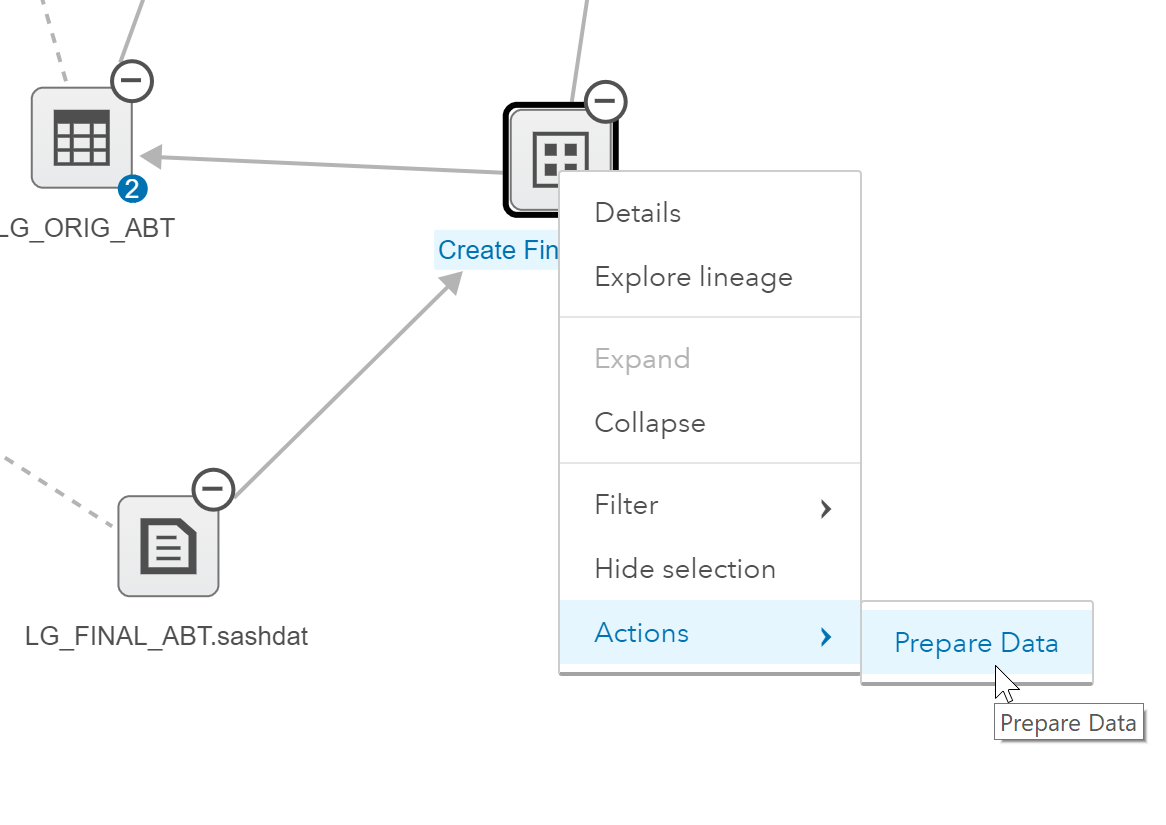
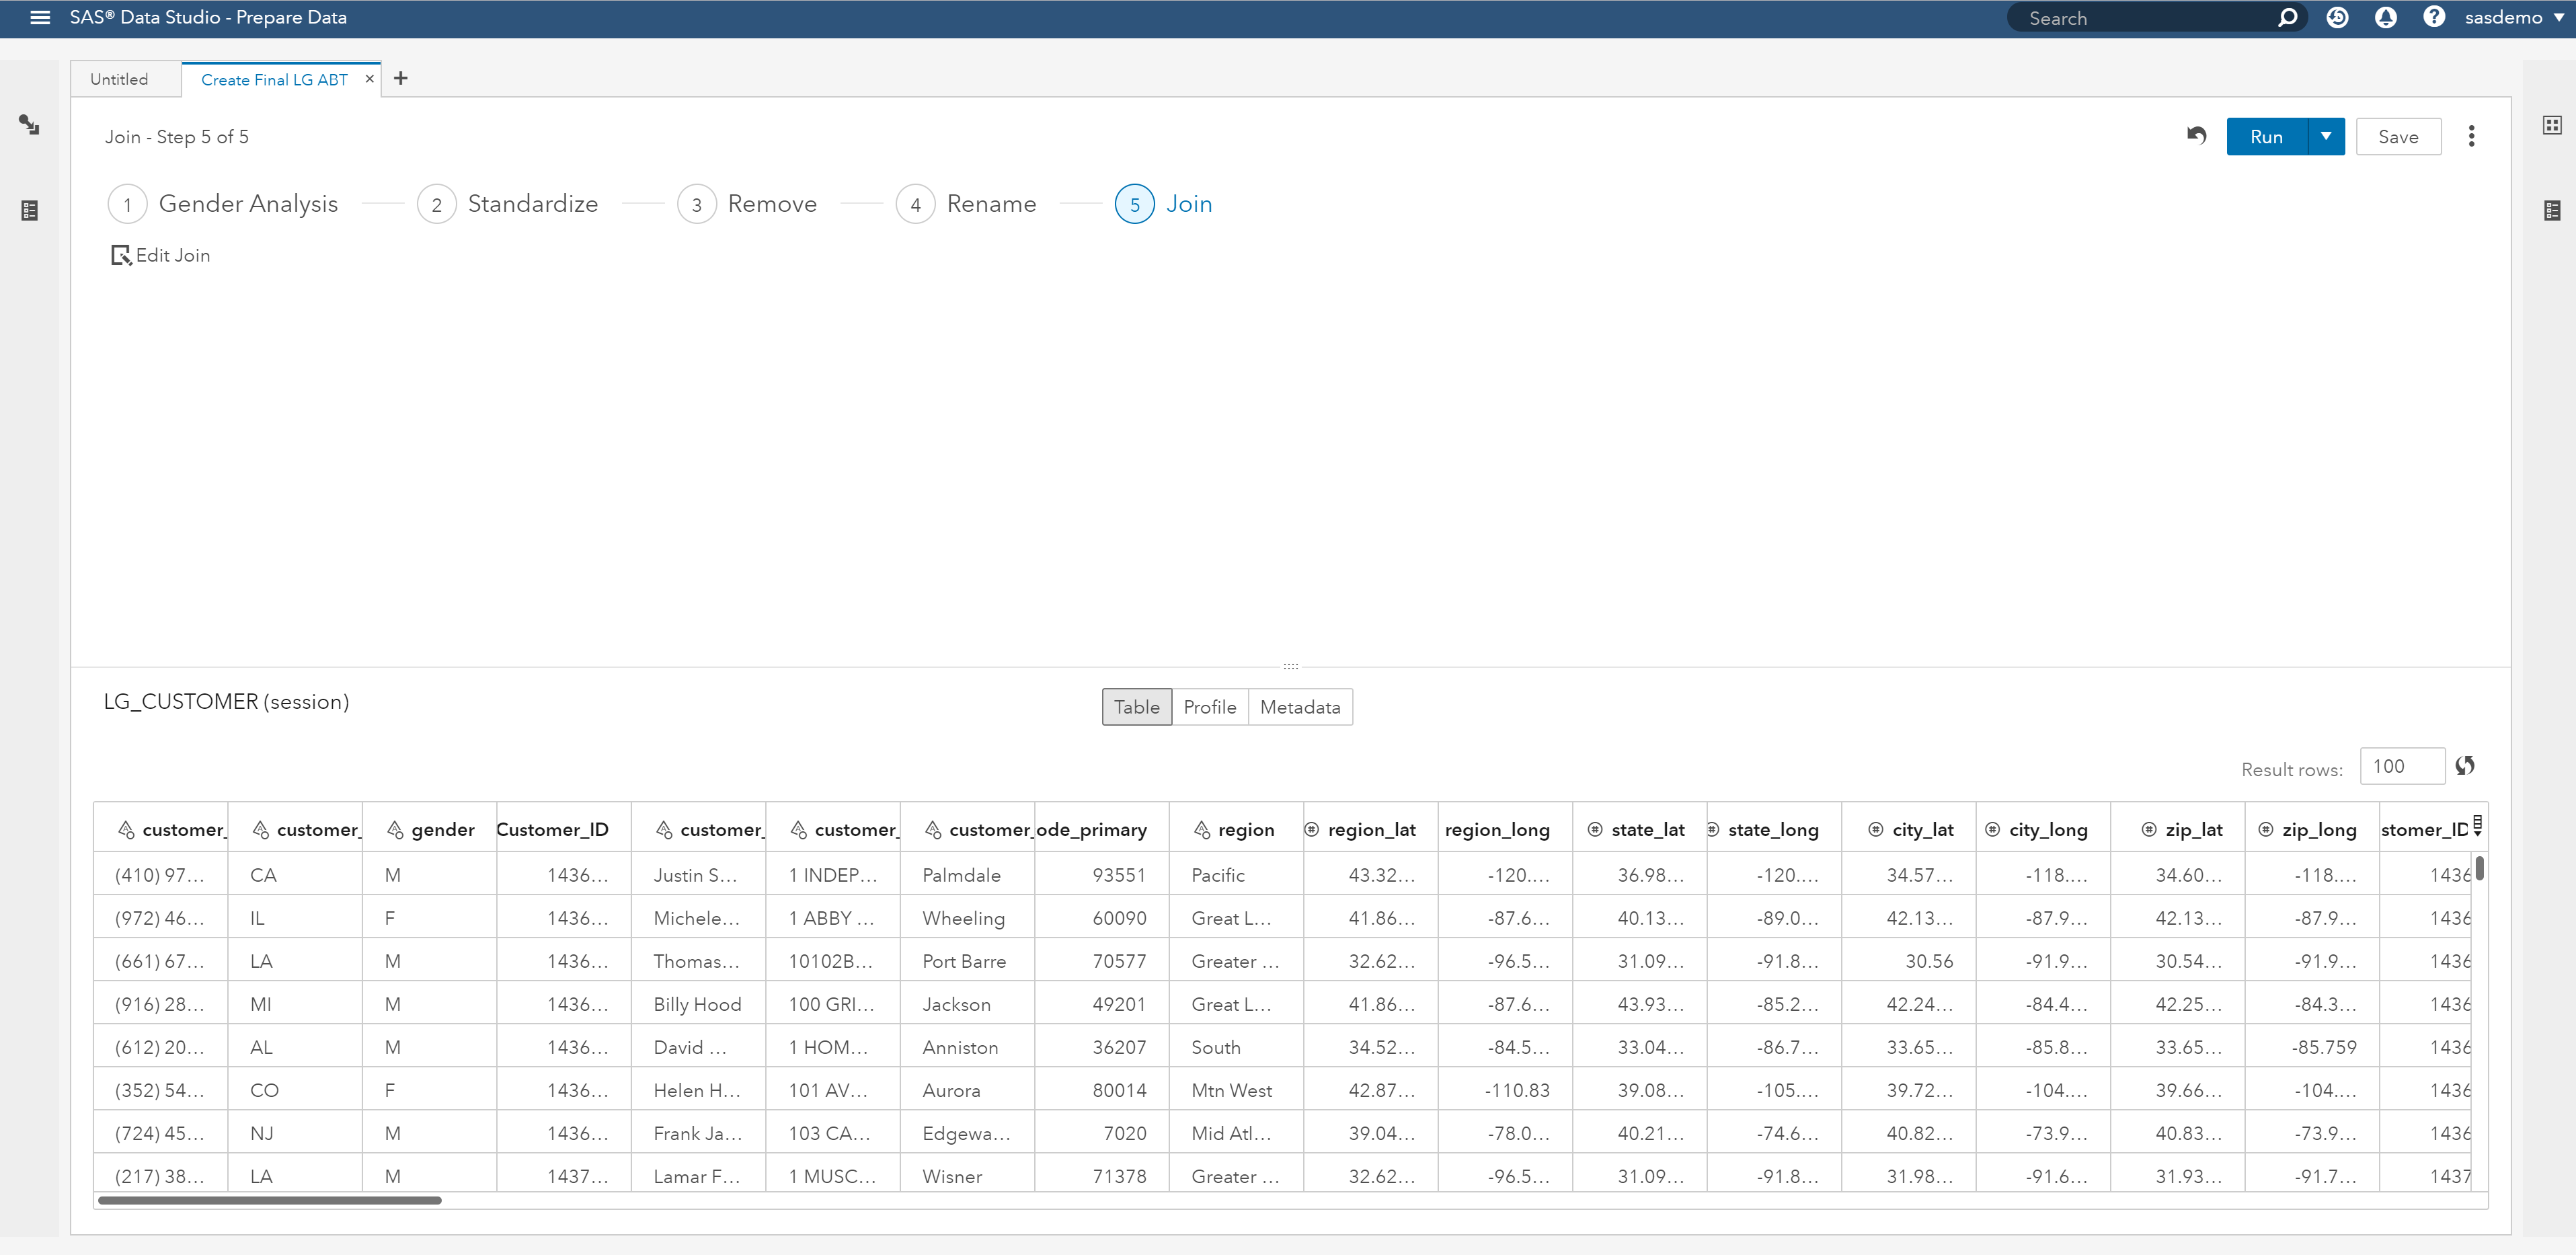
To dive deeper into the mashups and data manipulations that took place to produce LG_FINAL_ABT.sashdat, we can open the data preparation plan. To do this I’ll right click on Create Final LG ABT and select Actions then Prepare Data.
Here is the data preparation plan. At the top you can see that the creator of this data set performed five steps – Gender Analysis, Standardize, Remove, Rename and Join.
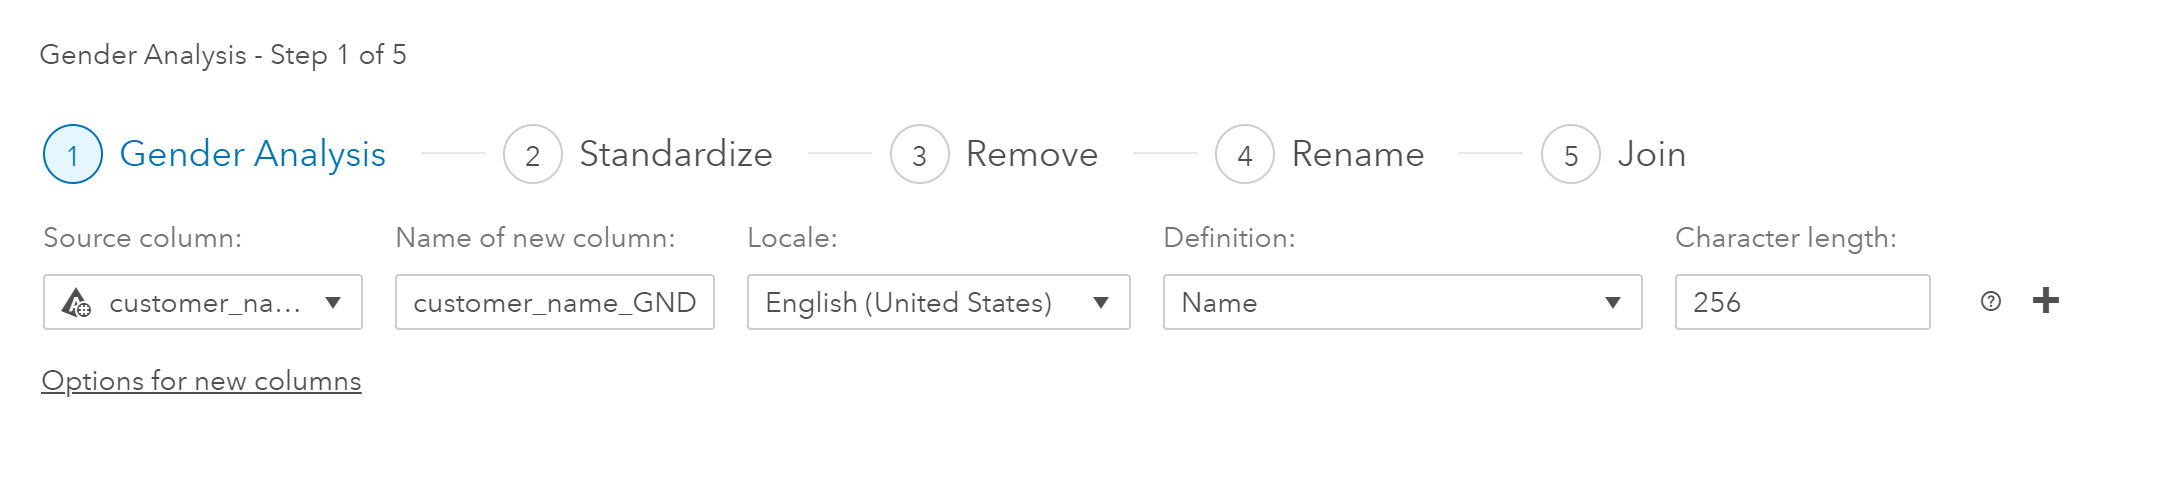
To get details into each of these steps, click on the titles at the top. Clicking on Gender Analysis, I see that a gender analysis was performed based on the customer_name field and the results were added to the data set in a variable named customer_name_GND.
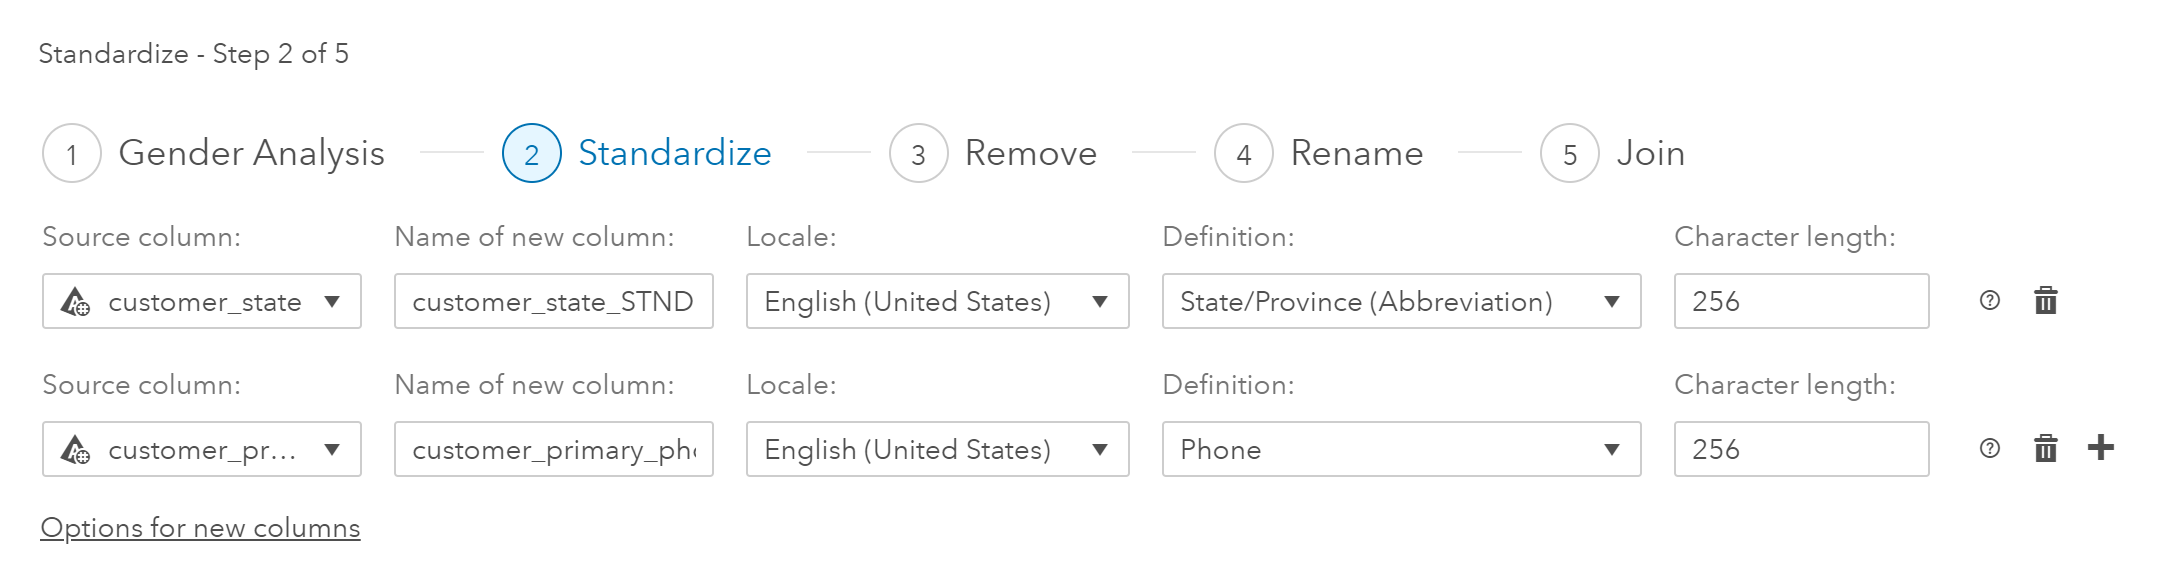
Clicking on the Standardize title, I see that there were two standardization tasks performed on the original data set. One for customer state and the other for customer phone number. I can also see that the results were placed in new fields (customer_state_STND and customer_primary_phone_STND).
Clicking on the Remove title, I see that three variables were dropped from the final dataset. These variables were the original ones that the user had “fixed” in the previous steps: customer_gender, customer_state, and customer_primary_phone.

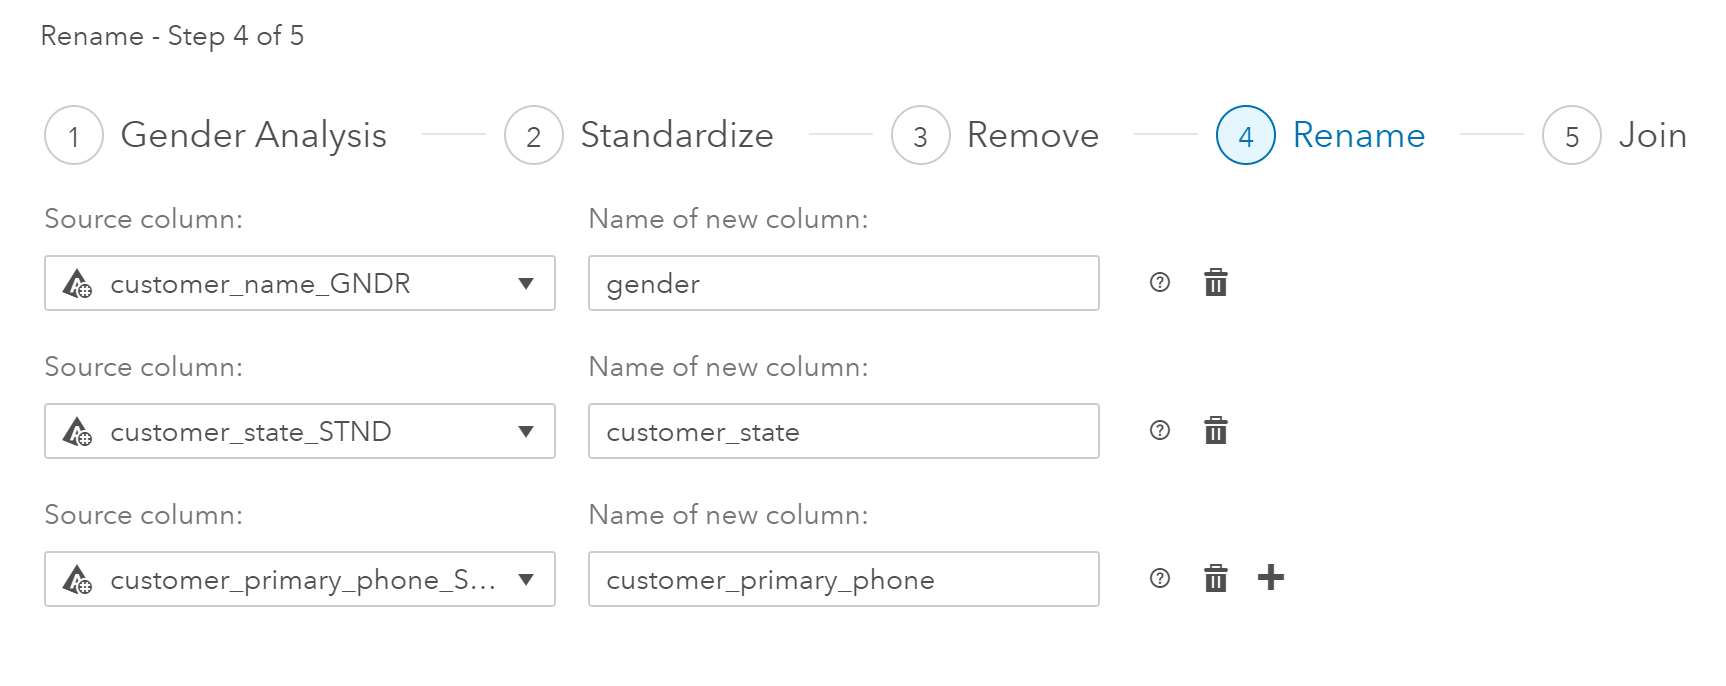
Clicking on the Rename title, I see that the new variables have been renamed.
The last step in the process is a join. Clicking on the Join title I see that LG_CUSTOMER was joined with LG_ORIG_ABT based on an inner join on Customer_ID.

We have just walked through the data lineage or data lifecycle for the dataset LG_FINAL_ABT, using SAS tools. I now understand how the data in the report we were looking at was generated. I am confident that the information that I gain from the report will be accurate.
Since sharing information and data among co-workers has become so common, it's now more crucial than ever to think about the data lifecycle. When you gain access to a report that you did not create it is always a good idea to check the underlying data to ensure that you understand the data and that any business insights gained are accurate. Also, if you are sharing data with others and you want to make modifications to it, you should always check the lineage to ensure that you won’t be undermining someone else’s work with changes you make. Thanks to SAS Visual Analytics, all the necessary tools one needs to review data lineage are all available within one interface.