The SAS Dummy
A SAS® blog for the rest of us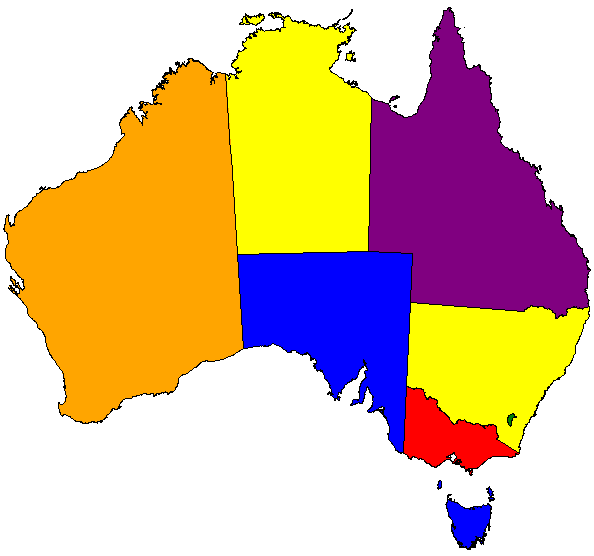

While talking to SAS users in Australia earlier this month, I often demonstrated the capabilities of the new Map Chart task in SAS Enterprise Guide 4.3. Creating map charts has never been easier: select your map data source, then select your response data source, and click Run. Voila! You've got
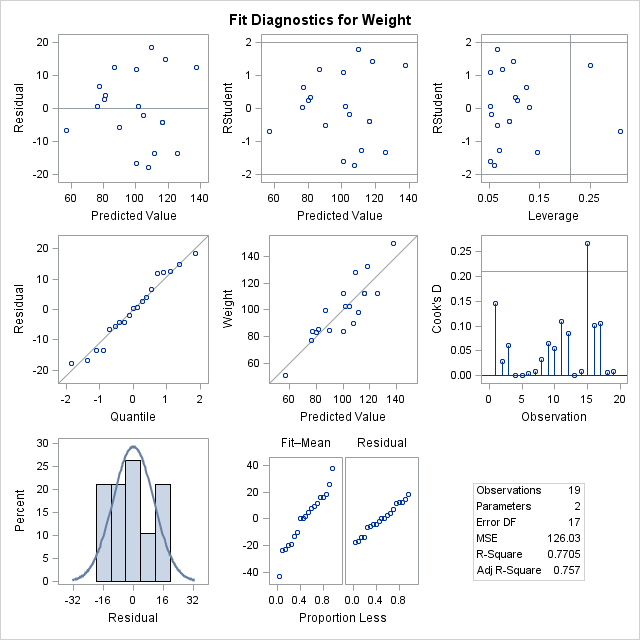
One of the great innovations with SAS 9.3 is the focus on ODS statistical graphics. "Wait a minute," you're thinking, "weren't ODS graphics added in SAS 9.2?" Yes, that's true. But with SAS 9.3 there is even more capability: more analytical SAS procedures support the graphs, and there are more

It seems like such a simple problem: how can you reliably compute the age of someone or something? Susan lamented the subtle issues using the YRDIF function exactly 1.0356164384 years ago. Sure, you could write your own function for calculating such things, as I suggested 0.1753424658 years ago. Or you