Do you ever look at a chart or graph and think about what it’s really trying to reveal? All the time, right? Visualizations are useful because they allow us to analyze information much quicker than if we were to look at the raw data by itself. I say this with
Tag: visual analytics
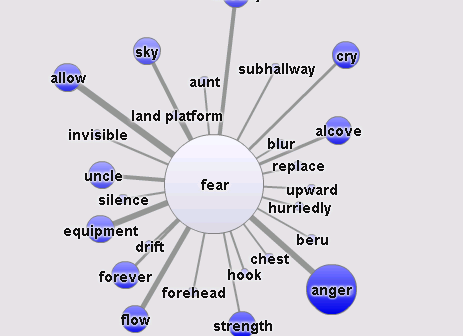
I'm an avid Star Wars fan, and am cautiously optimistic about what J.J. Abrams intends to do in Star Wars VII. The cast for the movie was revealed earlier this week, and today is May the Fourth, an unofficial Star Wars holiday. You might be asking yourself what any of
Imagine you're a business analyst who just discovered a pattern or trend that could significantly help your organization. What do you do next? You share it. Using SAS® Visual Analytics, you've published your results to the Web and mobile device before, but this time you'd rather work with your findings in

From Gartner to IDC to the trade press, the watchwords in the supply chain for rest of this decade appear to be “resiliency” and “responsiveness”. It’s not going to be about promotion-based pull-through, and it’s most definitely not going to be about channel incentive-based push-through. What it’s going to be
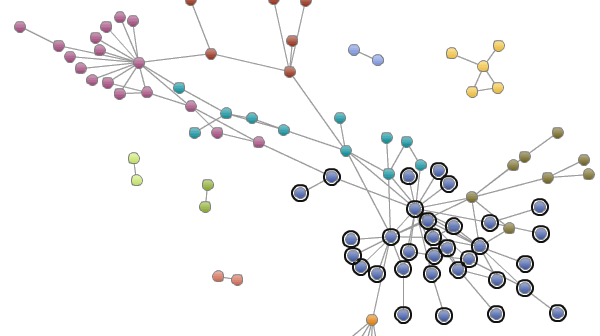
In this interconnected world, it is more important than ever to understand not just details about your data, but also how its different parts are related to each other. Social networks reveal often surprising details about what people think about your product or services, how they are linked to other
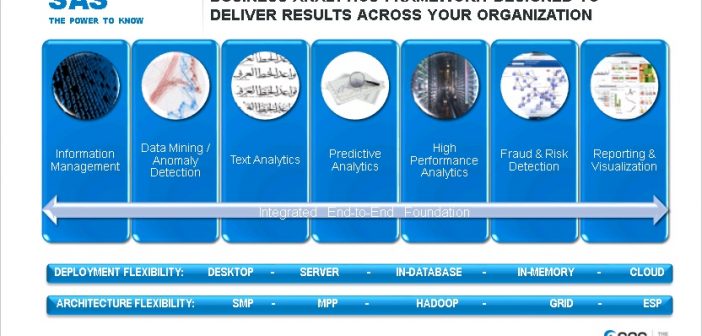
Over the years, in all my roles within SAS, I've been asked by customers, friends, family and all sorts of people, "What does SAS do?" Bottom-line: SAS delivers results across the organization, because that is what it was designed to do. Specifically, SAS was designed to deliver analytic results, which
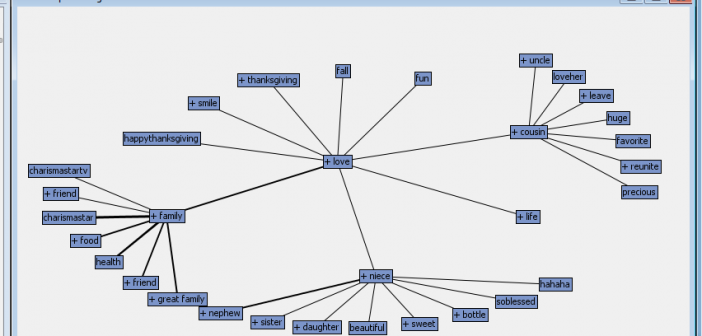
On Thanksgiving, I took a few moments out of my day to use the real-time Twitter search capabilities of SAS Social Media Analytics, and the search term #thankful. I didn’t do this because it’s almost year-end review time and I can say I worked on a holiday. Not entirely, anyway.
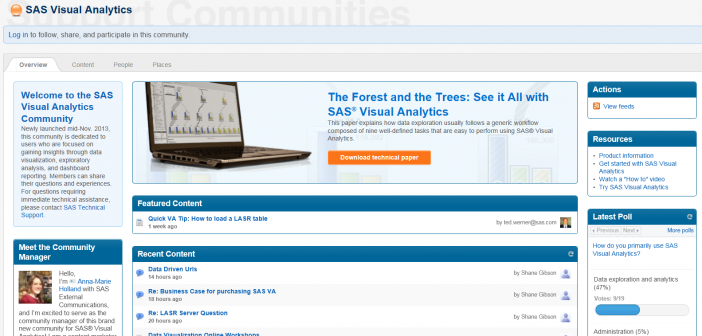
Looking for an information exchange for visual analytics? I'm happy to announce the arrival of the new SAS Visual Analytics support community! Have a question? Ask it. Have an idea to share? Post it. Join and you’ll have access to lots of great information and resources. The SAS Visual Analytics

Blockbuster recently announced it‘s throwing in the towel and closing its remaining 300 stores in early 2014. My how times change! Blockbuster, bought by Dish Network in 2011, was an integral and intimate part of our lives for years. Teens gathered at the neighborhood Blockbuster to rent movies and hang

SAS has had a good week. No. 1 in Analytics The company remains No. 1 in advanced analytics -- per IDC and Forrester, not just according to marketers like me. And we remain committed to innovation. Our data visualization offering, SAS Visual Analytics, is now used by more than 500


