Uncategorized

Data Visualization
Falko Schulz 16
Path analysis with SAS Visual Analytics

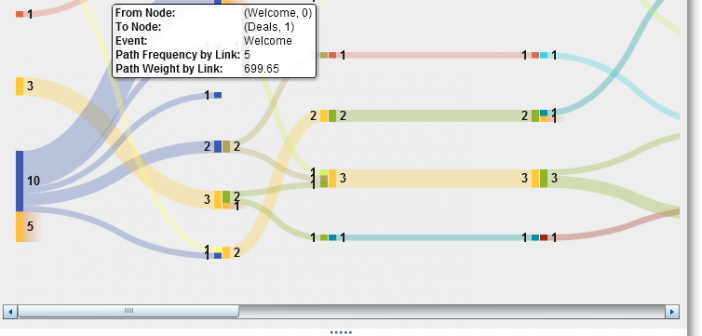
Introduction Understanding the behavior of your customers is key to improving and maintaining revenue streams. It is a an important part when crafting successful marketing campaigns. With SAS Visual Analytics 7.1 you can analyze, explore and visualize user behavior, click paths and other event-based scenarios. Monitoring the customer journey by visualizing

Steve Polilli 0
How are Hadoop deployments like snowflakes?

Because every single Hadoop deployment, like the structure of a snowflake, is different. For the open source big data framework, there are different distributions from various Hadoop vendors and all implementations are, or should be, tailored for that specific organization’s needs. And given this infinite variety of Hadoop foundations, the analytics

1 134 135 136 137 138 150