A tip for moving SAS Visual Analytics reports in SAS Viya 4 between SAS Viya environments

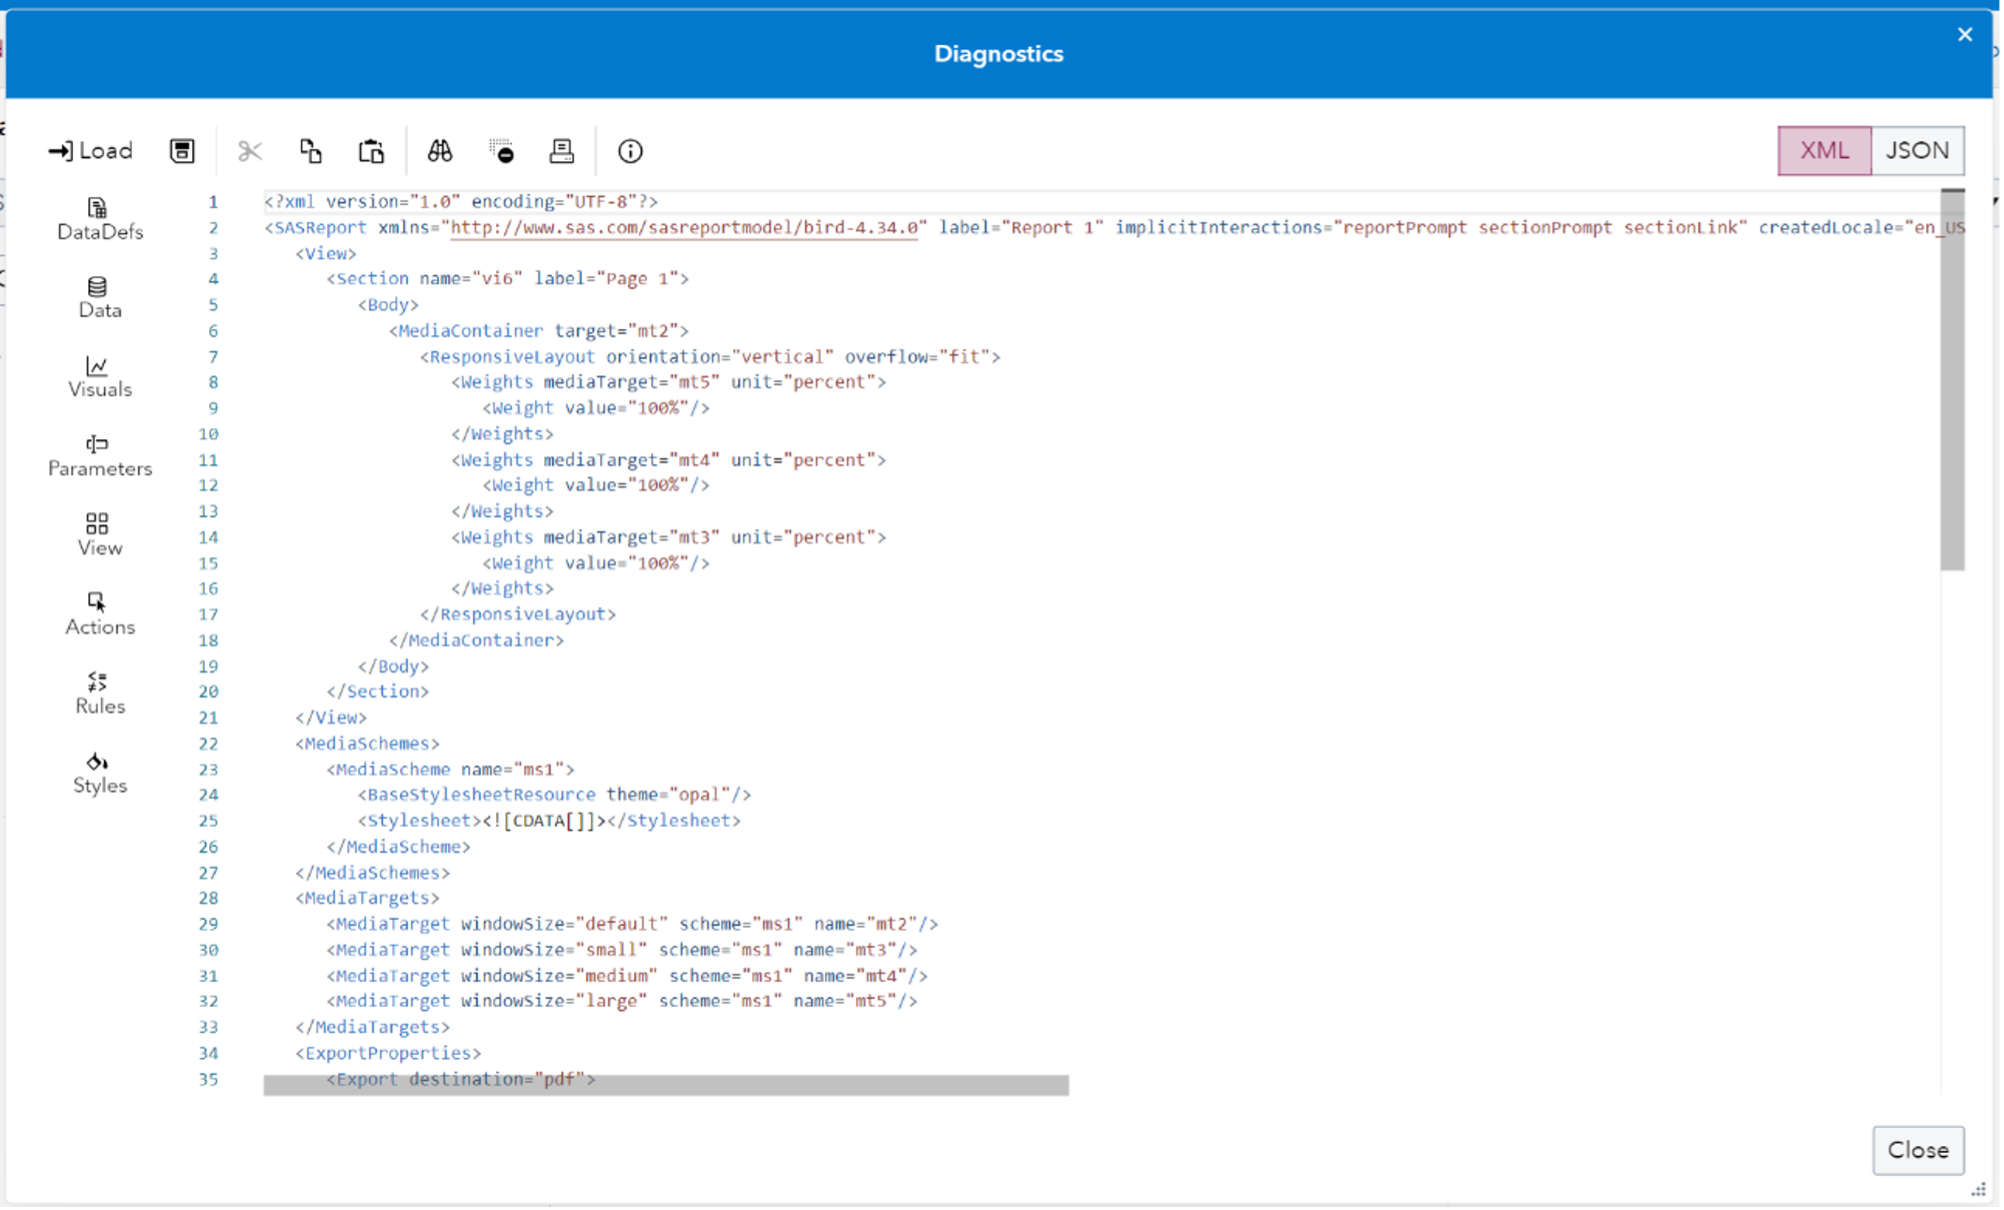
In SAS Viya 4 you can create Reports in SAS Visual Analytics that you may want to move around between machines. What if you want copy a report for example from a development environment folder to a production environment folder? You may want to work on the report in one system before putting it onto a final system and making it generally available. Or you may want to have a backup copy saved for recovery purposes. This blog post provides an updated description of how to easily save off SAS Visual Analytics report content to a file and easily move it between machines.