4 reasons SAS is empowering young minds to code in South Africa

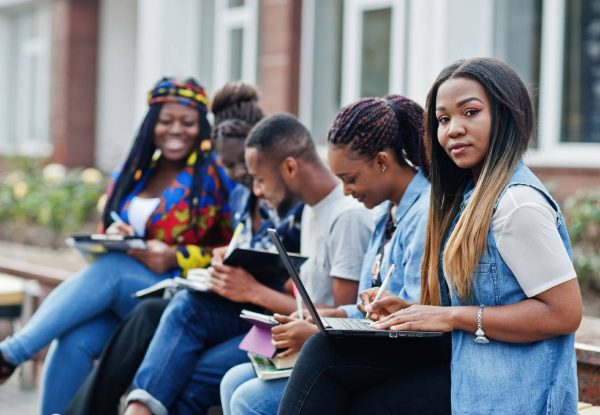
In the classrooms of South Africa, students are learning how to code with hopes of creating future opportunities for themselves. Coding4Mandela, an initiative honoring Nelson Mandela, strives to instill coding and technological skills in youth. The belief is that empowering young minds with digital literacy enhances their educational and professional