To celebrate special occasions like Father's Day, I like to relax with a cup of coffee and read the newspaper. When I looked at the weather page, I was astonished by the seeming uniformity of temperatures across the contiguous US. The weather map in my newspaper was almost entirely yellow and orange, which told me that the midday temperatures were predicted to have extremely small variation. It looked like the range of temperatures might vary by less than 30 degrees Fahrenheit (17 degrees Celsius), with most temperatures in the 70's and 80's.
To me this seemed like an extremely small variation, so that afternoon I downloaded the actual midday temperatures from Weather.com, which are shown below:
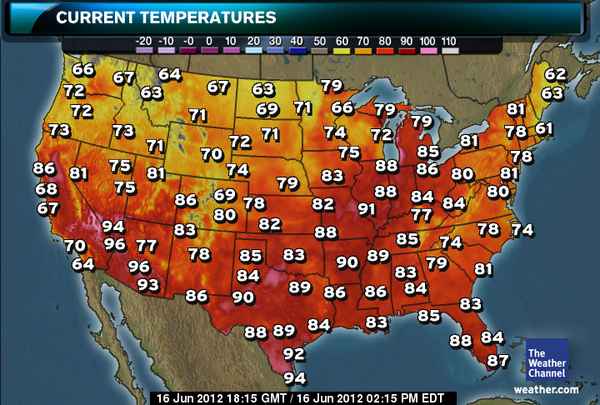
The Weather.com map uses a different color scale than my local paper. Nevertheless I quickly estimated that most of the temperatures were between 62 F and 92 F, with just a few hot spots in southern Texas, Arizona, and Nevada. The statistician in me wondered, what is the record for the "most uniform" temperatures at midday in the contiguous US? I'll bet that someone can automate the downloading of temperatures for standard US locations and answer the question. I'd love to see a graph of "temperature variation vs. date" for, say, the last ten or twenty years.
I don't know of a source for temperature data, but I figured that I might as well do SOME statistics to celebrate Father's Day weekend! I enlisted my youngest child to assist me in typing in the temperatures. (Yes, it was a father/daughter bonding moment.) I ran the following univariate analysis of the temperatures:
data Temps06162012; input Temperature @@; datalines; 66 72 72 73 86 81 68 67 70 64 64 67 63 73 71 75 81 75 94 96 77 96 93 67 71 72 70 74 69 86 80 83 78 86 63 69 71 71 79 78 82 83 85 84 89 90 88 89 92 94 79 66 79 74 72 75 88 83 88 82 91 88 89 90 86 86 83 84 79 81 85 86 80 84 84 77 85 74 79 83 84 85 62 63 81 61 78 78 81 80 74 78 81 83 84 88 87 ; proc univariate data=Temps06162012; var Temperature; histogram Temperature; run; |
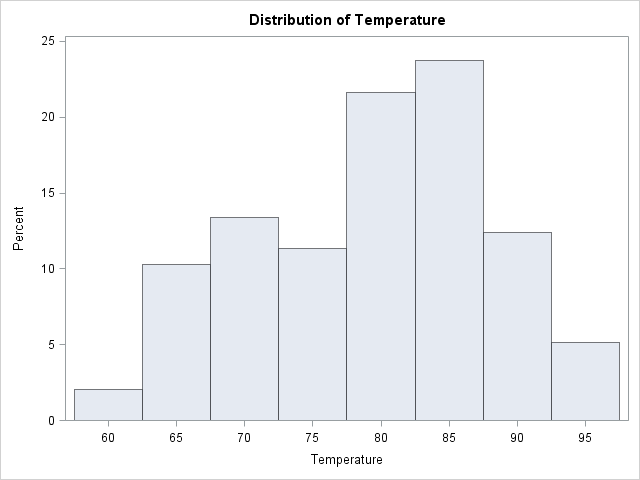
The histogram and the accompanying tabular output told me that the mean temperature was a comfortable 79 degrees F, and that the standard deviations of temperatures was a paltry 8.56 degrees F. It was, indeed, a beautiful weekend for celebrating Father's Day.
Can anyone find a date for which the temperatures exhibited less variation? I'd love to see the analysis.

3 Comments
I can't think of a finer weather on a Father's Day Sunday. Of course, I'm not basing this on science, just my husband's quote while we were enjoying coffee on the patio. Great post, Rick!! (As always.)
It rained here on Father's Day, so my kids decided they wanted to take Dad to a movie & we spent the afternoon giggling at The Three Stooges.
Here's a histogram of the data with the mean and standard deviation added.