The DO Loop
Statistical programming in SAS with an emphasis on SAS/IML programs
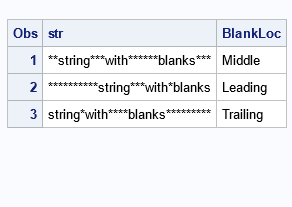
A SAS programmer noticed that his SAS output was not displaying multiple blanks in his strings. He had some strings with leading blanks, others with trailing blanks, and others with multiple blanks in the middle. Yet, every time he used SAS to print the strings to the HTML destination, something

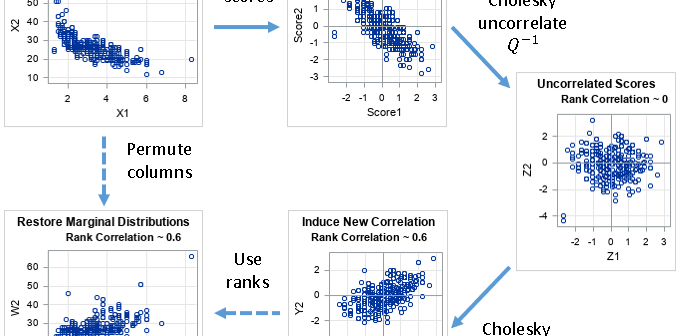
A previous article showed how to simulate multivariate correlated data by using the Iman-Conover transformation (Iman and Conover, 1982). The transformation preserves the marginal distributions of the original data but permutes the values (columnwise) to induce a new correlation among the variables. When I first read about the Iman-Conover transformation,

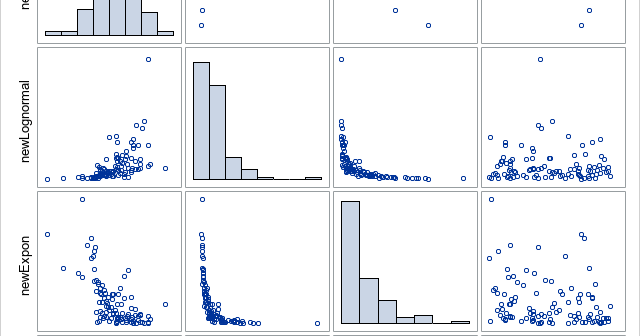
Simulating univariate data is relatively easy. Simulating multivariate data is much harder. The main difficulty is to generate variables that have given univariate distributions but also are correlated with each other according to a specified correlation matrix. However, Iman and Conover (1982, "A distribution-free approach to inducing rank correlation among
