The DO Loop
Statistical programming in SAS with an emphasis on SAS/IML programs
SAS provides procedures to fit common probability distributions to sample data. You can use PROC UNIVARIATE in Base SAS or PROC SEVERITY in SAS/ETS software to estimate the distribution parameters for approximately 20 common distributions, including normal, lognormal, beta, gamma, and Weibull. Since there are infinitely many distributions, you may

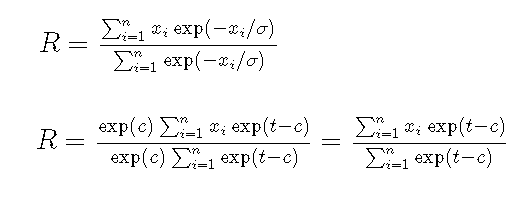
Many common probability distributions contain terms that increase or decrease quickly, such as the exponential function and factorials. The numerical evaluation of these quantities can result in numerical overflow (or underflow). This is why we often work on the logarithmic scale: on the log-scale, the numerical computations for equations such

Suppose you measure data weekly. According to the ISO standard, weeks are measured in the range 1-53, where most years have 52 weeks, but occasionally there is a "leap week." (The WEEK function in SAS implements the ISO standard to find the week-of-the-year for any date.) The heat map to
