The DO Loop
Statistical programming in SAS with an emphasis on SAS/IML programs
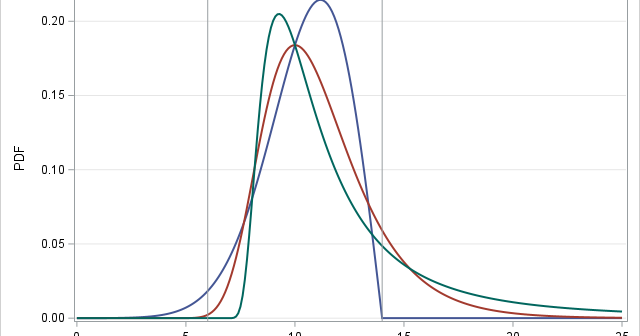
SAS supports more than 25 common probability distributions for the PDF, CDF, QUANTILE, and RAND functions. If you need a less-common distribution, you can implement new distributions by using Base SAS (specifically, PROC FCMP) or the SAS/IML language. On the SAS Support Communities, a SAS programmer asked how to implement

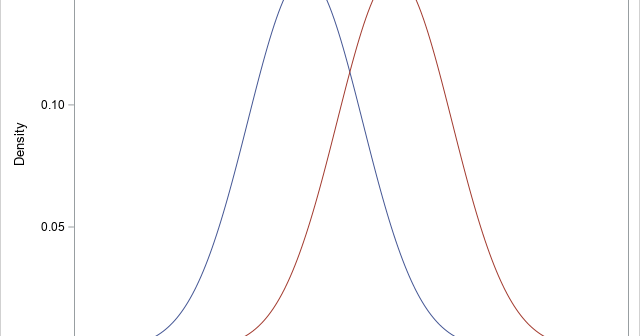
A previous article discusses Cohen's d statistic and how to compute it in SAS. For a two-sample independent design, Cohen's d estimates the standardized mean difference (SMD). Because Cohen's d is a biased statistic, the previous article also computes Hedges' g, which is an unbiased estimate of the SMD. Lastly,

What is Cohen's d statistic and how is it used? How can you compute it in SAS? This article gives some history behind Cohen's d statistic. It shows how to compute the statistic in SAS for the difference in means between two independent samples. It shows how to estimate a
