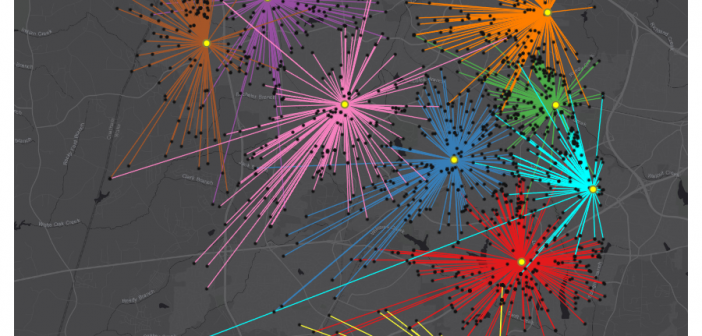
Many cities have Open Data pages. But once you download the data, what can you do with it? This is my second blog post where I download several datasets from Cary, NC's open data page, and and give you a few ideas to get you started on your own data

Many cities have Open Data pages. But once you download the data, what can you do with it? This is my second blog post where I download several datasets from Cary, NC's open data page, and and give you a few ideas to get you started on your own data
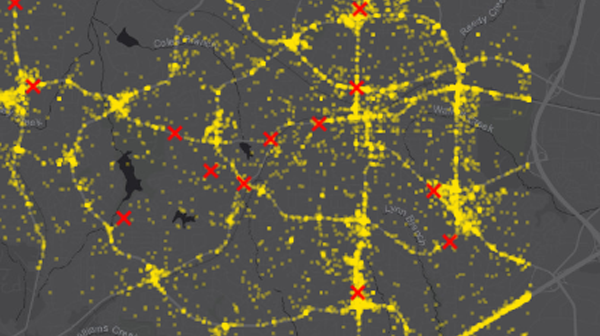
Many cities have Open Data pages. But once you download this data, what can you do with it? I'm going to download several datasets from Cary, NC's open data page, and try to give you a few ideas to get you started on your own data exploration! And what data

Some claim that deaths in the US have been increasing, and some claim they have been decreasing. Which do you think is correct? Let's take a look at the data ... The Data Here in the US, the Centers for Disease Control and Prevention is a good/official source of data

How long do dogs live? ... That's a good/tough question. Some live longer than others, but what are the determining factors? Let's throw some data to this problem, and see if we can fetch some answers! But before we get started, how about a random picture to get you into
Having earned the Eagle Scout rank in Boy Scouts, I am of course very conservation-minded, and against polluting. I'm also an avid boat paddler and fisherman, and therefore I'm especially concerned about pollution in our rivers, lakes, and oceans. I even volunteered for a week to help survey coral reefs

I've got this buddy, Carter Johnson - he's a little bit crazy, but a lot of fun to follow... He holds/held several different long-distance paddling world records, and was one of the coaches for the group that paddled kayaks from Cuba to the US (see my blog post). A few
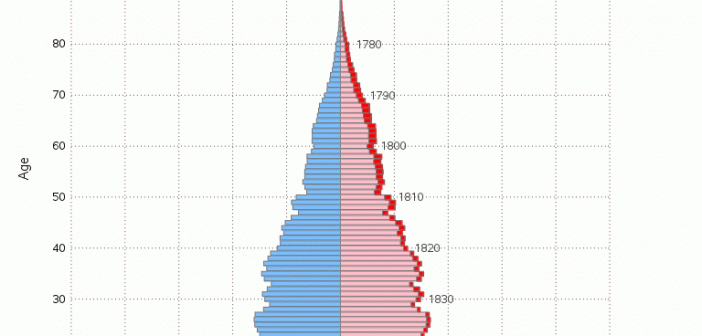
You've probably seen a population pyramid, such as this one I showed in a previous blog post. But let's scrutinize population pyramids a bit deeper, with an eye on special features that can make them even more useful! I was inspired to give population trees a second look by this
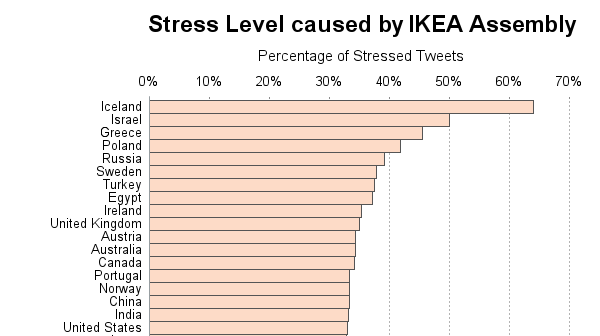
Have you ever brought home a piece of furniture-in-a-box, and felt undue stress while trying to make sense of the directions to assemble it? ... Apparently you're not alone! A recent analysis studied ~50,000 tweets about IKEA furniture, and determined whether the people posting the tweets were frustrated. They then
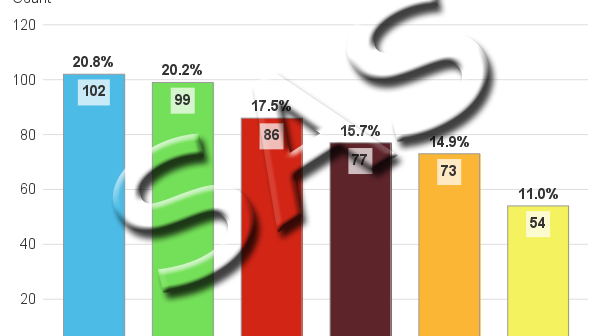
This is another in my series of blog posts where I take a deep dive into converting customized R graphs into SAS graphs. Today we'll be working on bar charts ... And to give you a hint about what data I'll be using this time, here's a picture from a SAS
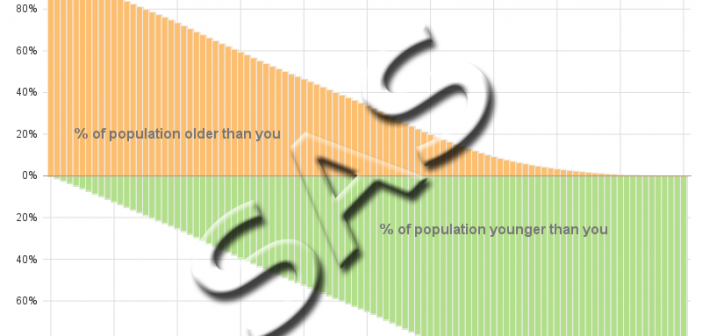
This is another in my series of blogs where I take a deep dive into converting a customized R graph into a SAS graph. Today I'm focusing on a diverging bar chart (where one bar segment is above the zero line, and the other is below). What type of data