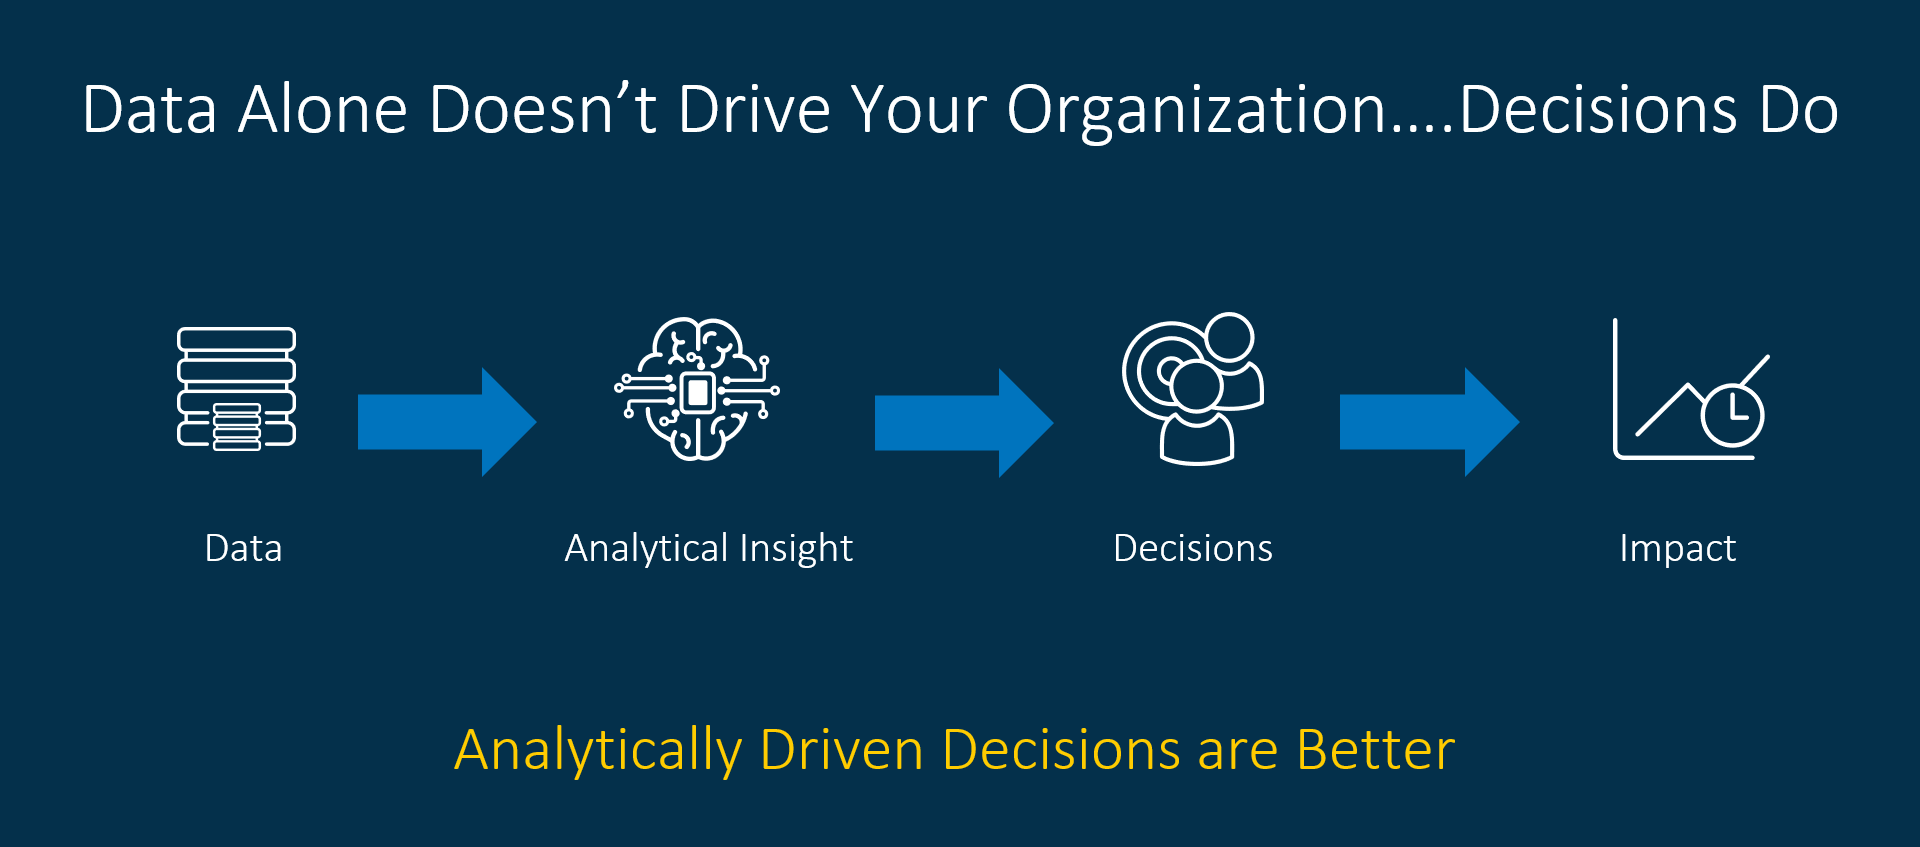
The marketing industry has never had greater access to data than it does today. However, data alone does not drive your marketing organization. Decisions do. And with all the recent hype regarding the potential of AI, a successful cross-channel campaign is propelled by a personalized, data-driven approach injected with machine learning.
According to my SAS peers Andy Bober and Steve Hill in their SAS Global Forum 2019 white paper:
“Despite the challenges of complex data privacy regulations, rising consumer expectations, and always-on competition, marketing technology is now starting to deliver on many long-time promises such as one-to-one marketing and customer journey management.
But there are still hurdles to address. As consumers, we want businesses to consistently treat us as if they know us, regardless of the time, circumstances, or place. As marketing technologists, we want to leverage the flexibility afforded by Software as a Service (SaaS) and cloud computing, but we don’t want to be the next business to be in the news for a data breach or a General Data Protection Regulation (GDPR) violation. Hybrid marketing addresses these critical dissonances.”
Hybrid marketing background
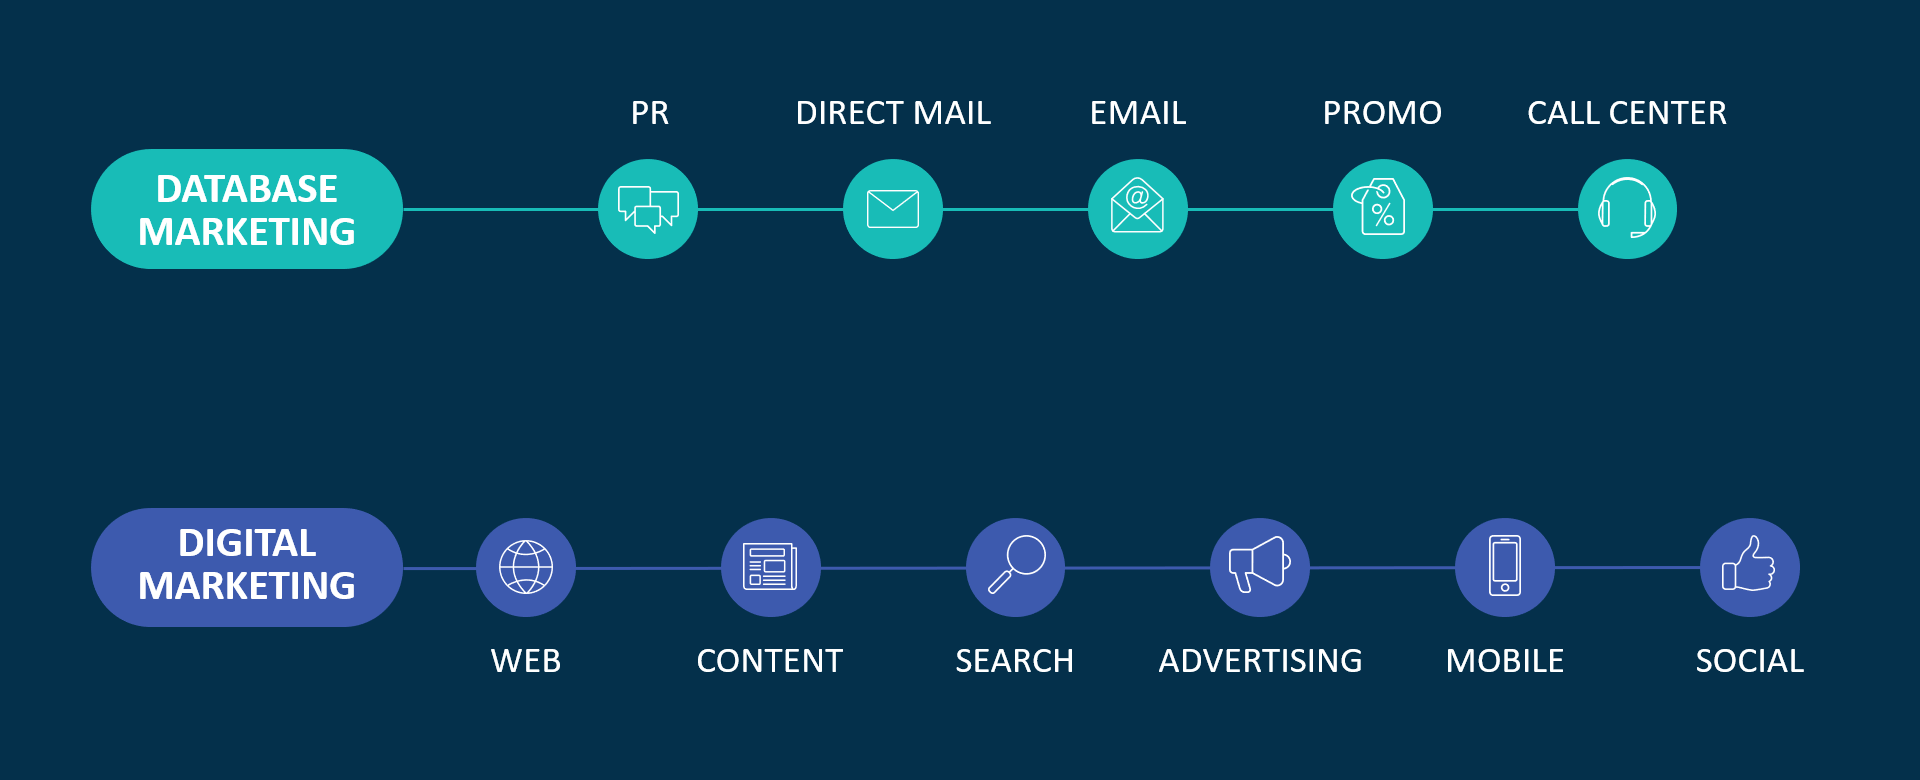
Hybrid marketing can be summarized by two areas:
The concept of integrated marketing evolved when digital marketing matured and brands recognized these two disciplines could no longer operate in silos. Over the past decade, the industry hasn’t fallen short of buzzwords to generate excitement about the potential.
This year, the concept of AI (or artificial intelligence) is a great example. Everyone is talking about it, but few really know how to do it. Everyone thinks everyone else is doing it, so everyone claims they're doing it. Unfortunately, a lot of what one hears about AI is sensationalized. Indeed, AI is over-hyped. But AI is also real and powerful, and the marketing space is craving it.
However, customers don’t care how complicated and convoluted the martech ecosystem is. The frustration with the industry overall has led to personal privacy legislation, such as GDPR, which places more responsibility on brands to protect their customers’ data. So, how can marketers interact with their customers and prospects in a respectful, yet personal manner?
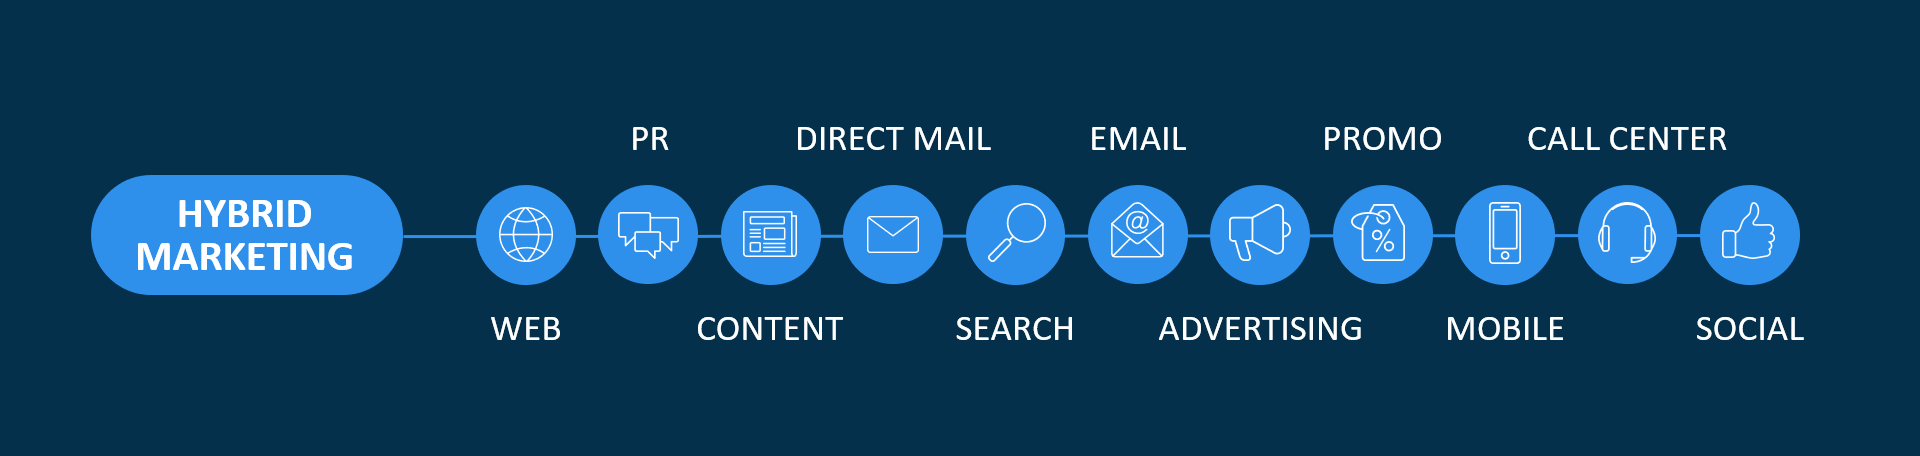
Hybrid marketing combines the capabilities of direct and digital marketing in a single platform. Organizational silos break down, enabling analysts and channel managers to leverage online and offline data to improve customer journeys and the efficacy of their efforts.
How does hybrid marketing work?
There are important considerations when a technology vendor requires a brand to on-board their managed customer data and intellectual property into a cloud solution, namely:
- Data duplication
- Synchronization
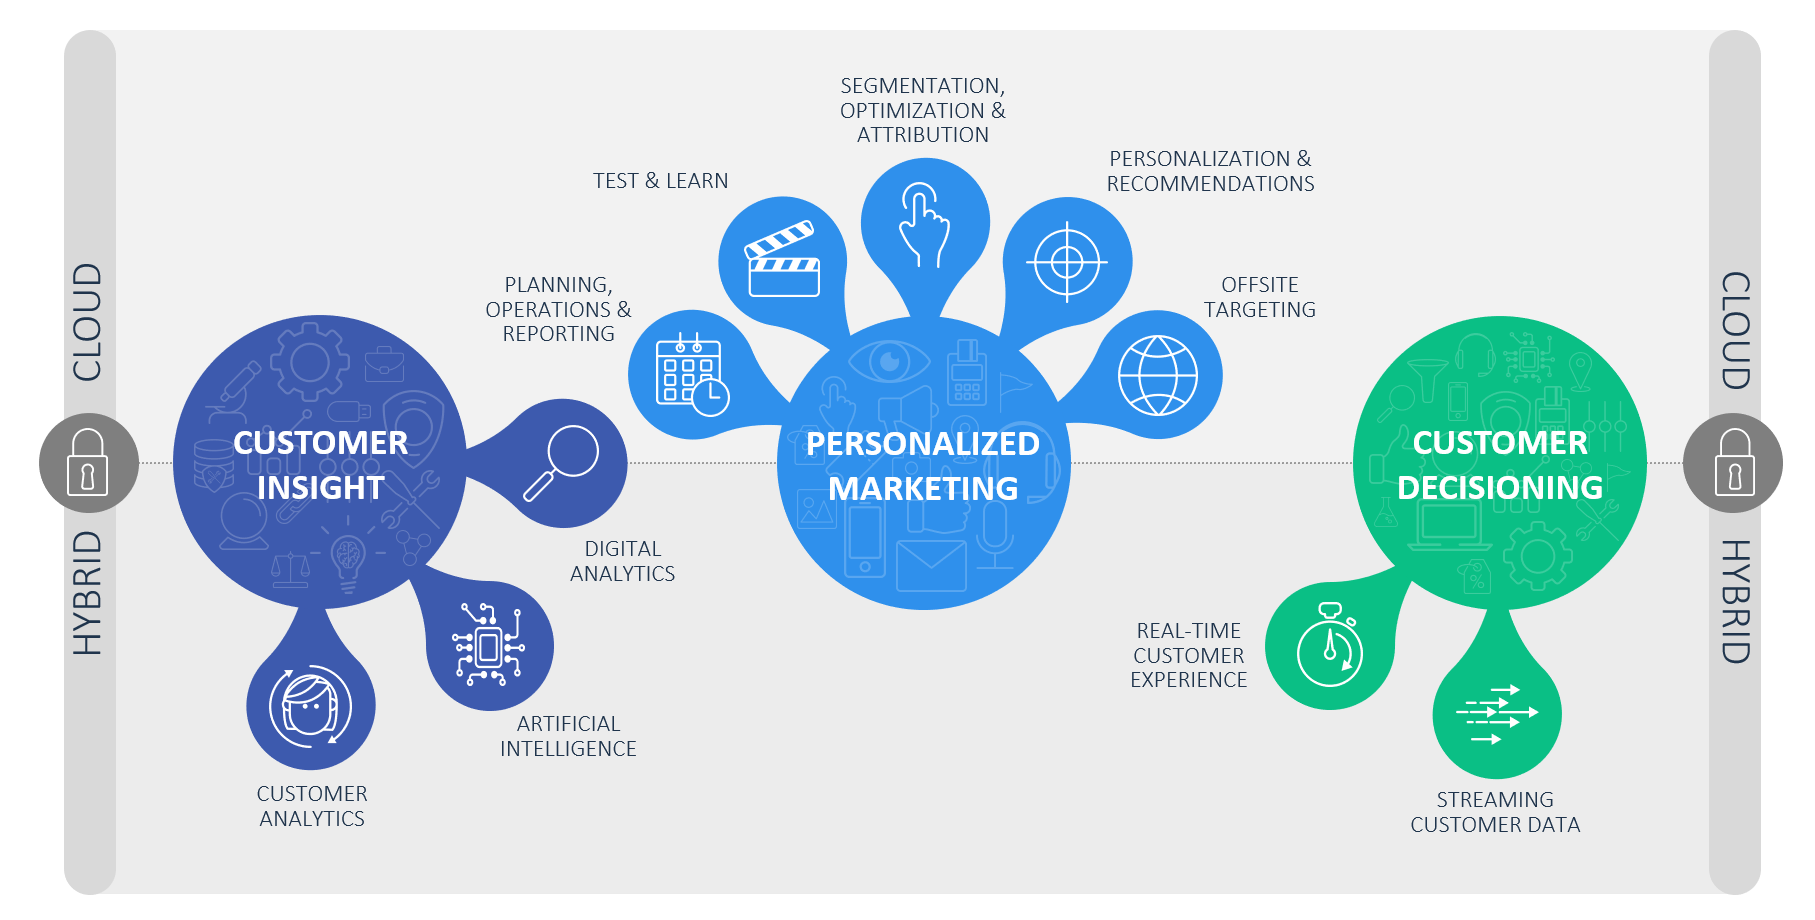
Unless your brand is moving all of their operational and marketing systems to a single location, this will always be a challenge. Instead of requiring brands to go down this path, SAS Customer Intelligence 360 provides a secure, Web socket-based connection between your chosen data management environment and our marketing cloud platform.
The connections are labeled as an API gateway of agents and provide a plug-in and SDK framework that allow integration with any external system. While not the focus of this article, readers can learn more about the agent framework by reviewing this white paper by Toshi Tsuboi and Stephen Cuppett.
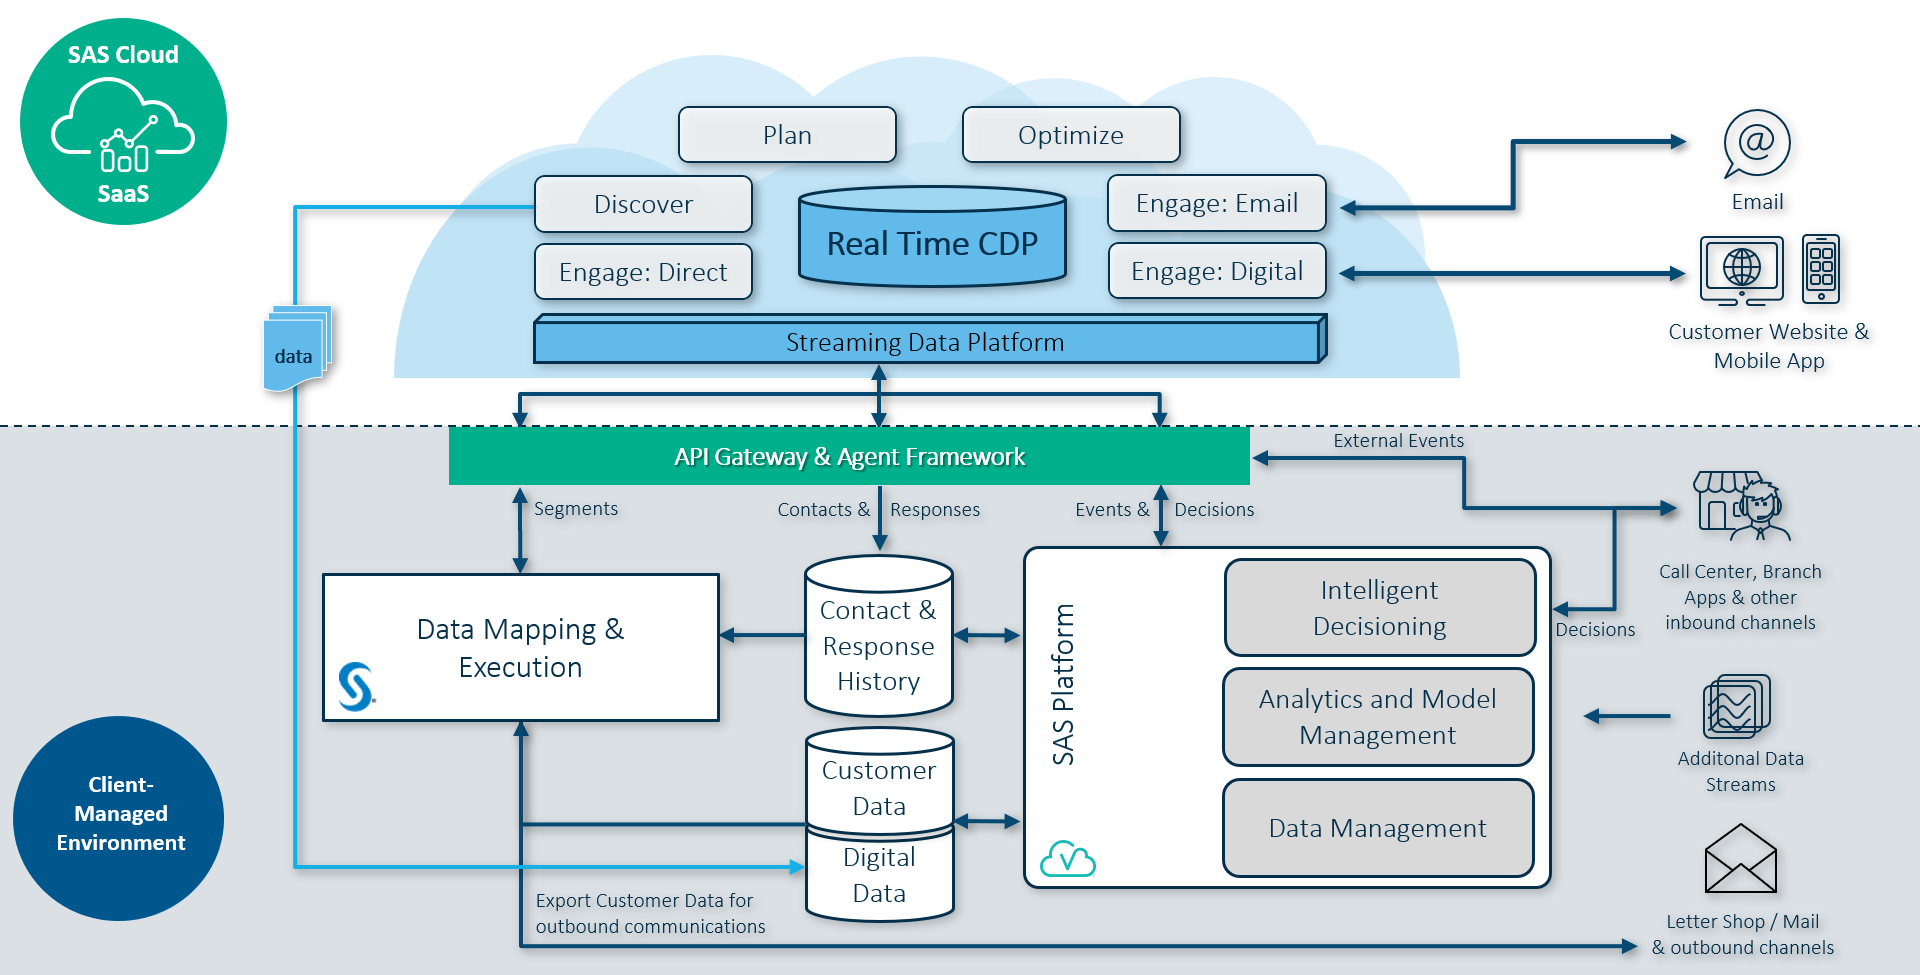
Rather than requiring the movement and duplication of any of your brand’s managed first-party customer data to SAS Customer Intelligence 360, the hybrid marketing design allows mapping a customer identity from your data repository to an anonymous hashed identity in the SAS cloud. For clarity, your managed environment can be on-premises, hosted by another company, or stored in a cloud system. It’s your choice and you control your data.
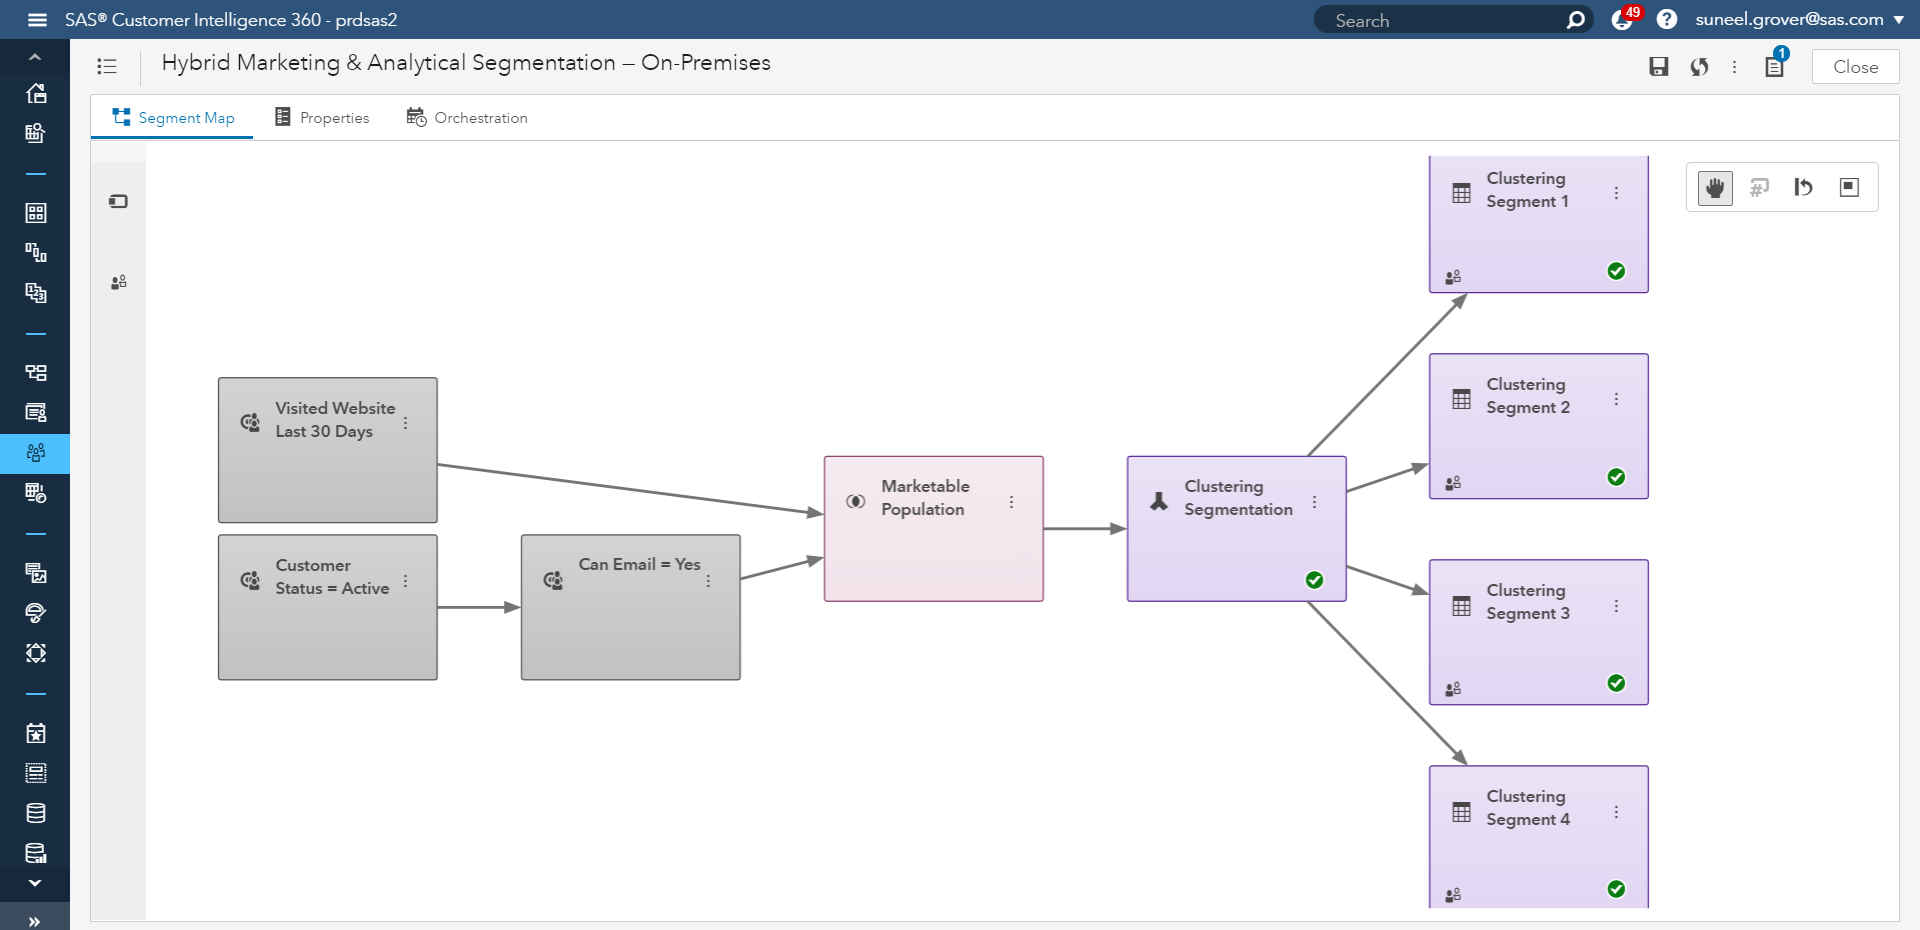
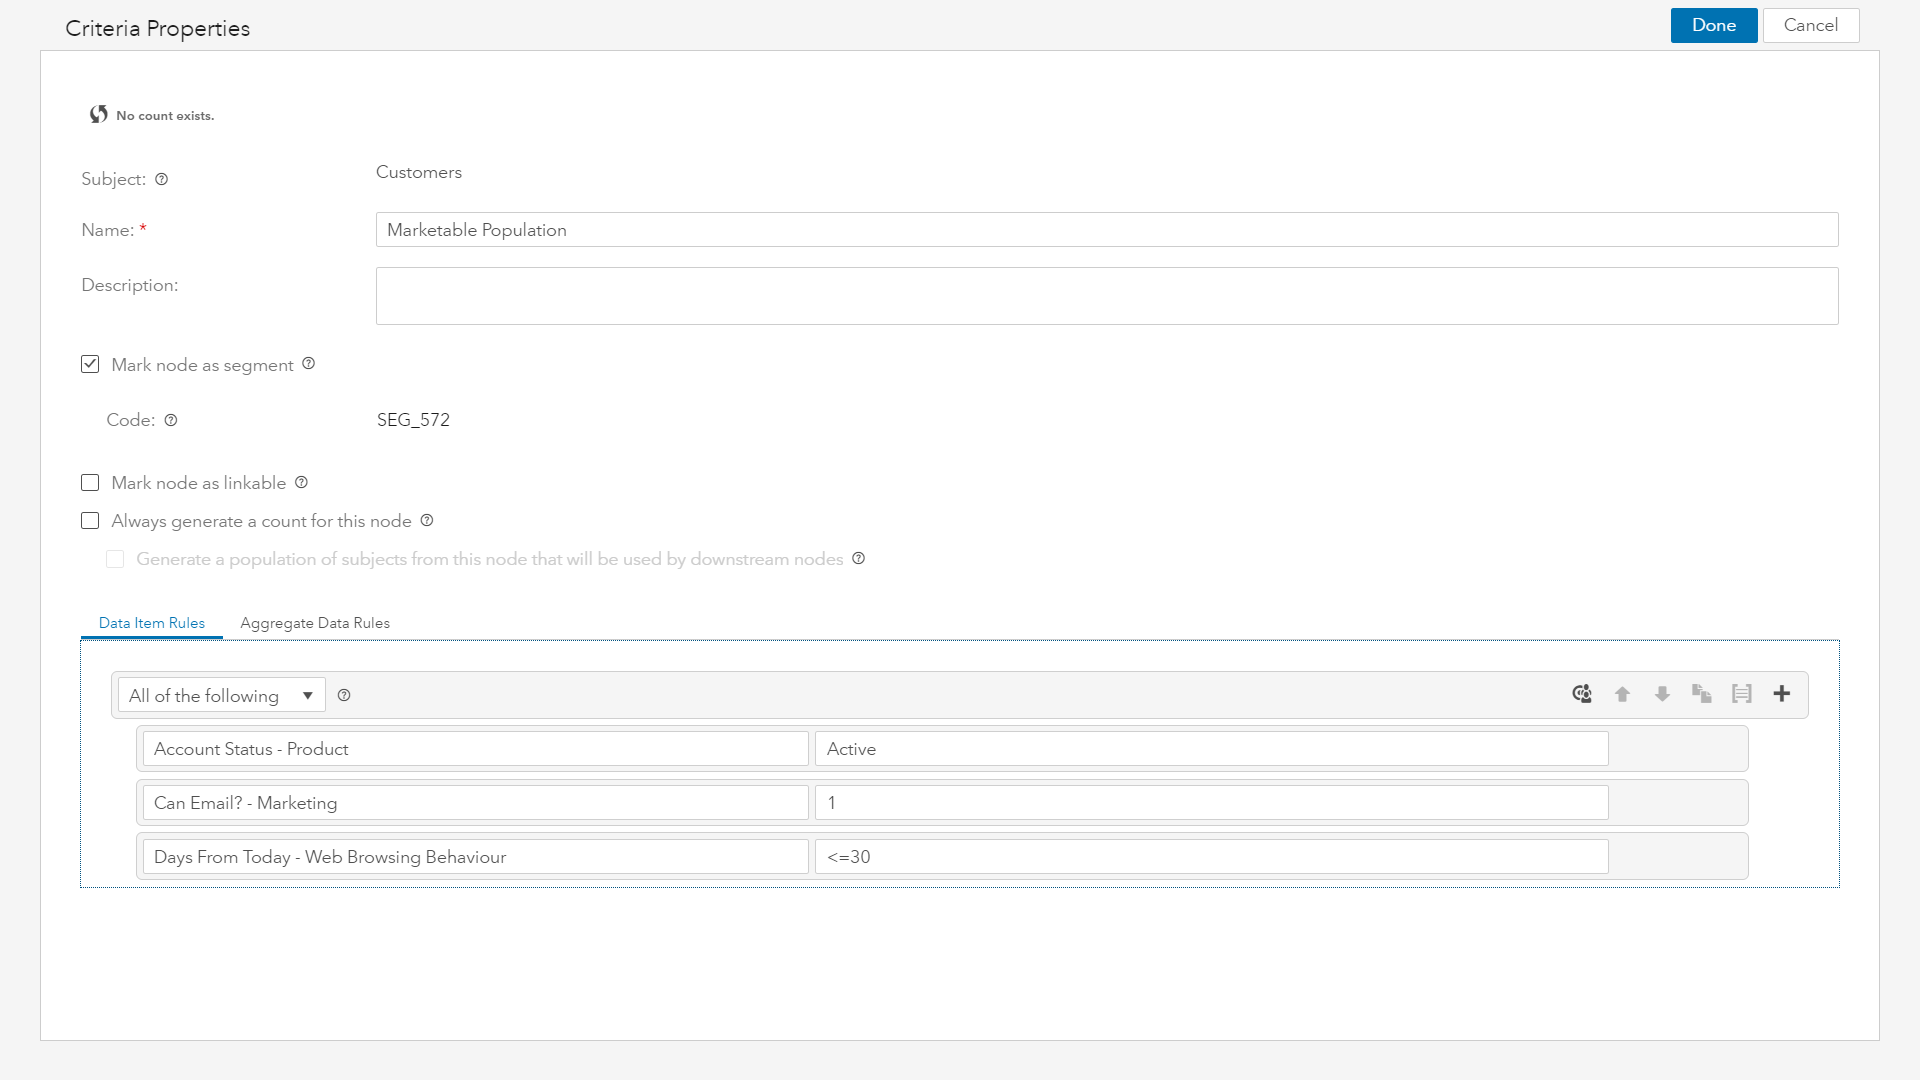
Let’s look at a segmentation example for multi-touchpoint targeting. A brand has a large volume of customers in their on-premise database, including Suneel and Jeri, who are active customers, opted-in for email communications, interacted with the brand online in the last 30 days, and have been scored by a machine learning model for their propensity to convert.
As with most CRM databases, countless attributes are available ranging from demographics, psychographics, house-holding, transactions, analytical scores, third-party appends, etc.. What's been missing in these environments historically is the availability of structured online user behavior, which has typically been in a silo within an external cloud platform. Not anymore.
A key value prop here is that there are no personal identifiers for Suneel or Jeri in SAS Customer Intelligence 360. Instead, Suneel is mapped by an anonymous ID, ABC123, and Jeri by XYZ789. If a marketer wants to target a segment, the platform can query information residing in the brand’s CRM managed database, as well as leverage cloud-stored data captured from owned digital media (web, mobile app, etc.).
This is similar to traditional campaign management (or marketing automation) processes, except instead of requiring your organization to duplicate all your first-party offline data in the vendor’s cloud solution, the individuals who meet your use case’s targeting criteria are simply mapped to a segment in SAS Customer Intelligence 360. No Suneel, no Jeri, nor any other personal information about them, just ABC123 and XYZ789, along with other customer-linked anonymous identities that are now associated with your defined segment.
Hybrid marketing and analytics
Another massive differentiator in favor of hybrid marketing is the availability of your preferred machine learning technology to add value to your campaign management workflow. It's no longer a debate that analytically-driven decisions are better in driving measurable impact.
The hype behind AI is primarily focused on augmenting decisions, process, natural language processing and computer vision. The result is a set of trends made up of:
- Algorithms producing better analytics and accuracy.
- Automation of machine learning aligned to more productivity.
- Embedded analytics making AI more impactful and consumable.
- Human-like interfaces creating approachability.
What happens when AI becomes useful for your brand? It effectively can be renamed from artificial intelligence to analytical integration of any internal process or external customer experience your organization facilitates. But there are barriers to AI adoption, including the lack of:
- Talent
- Stakeholder buy-in
- End-to-end solutions
- Data strategy
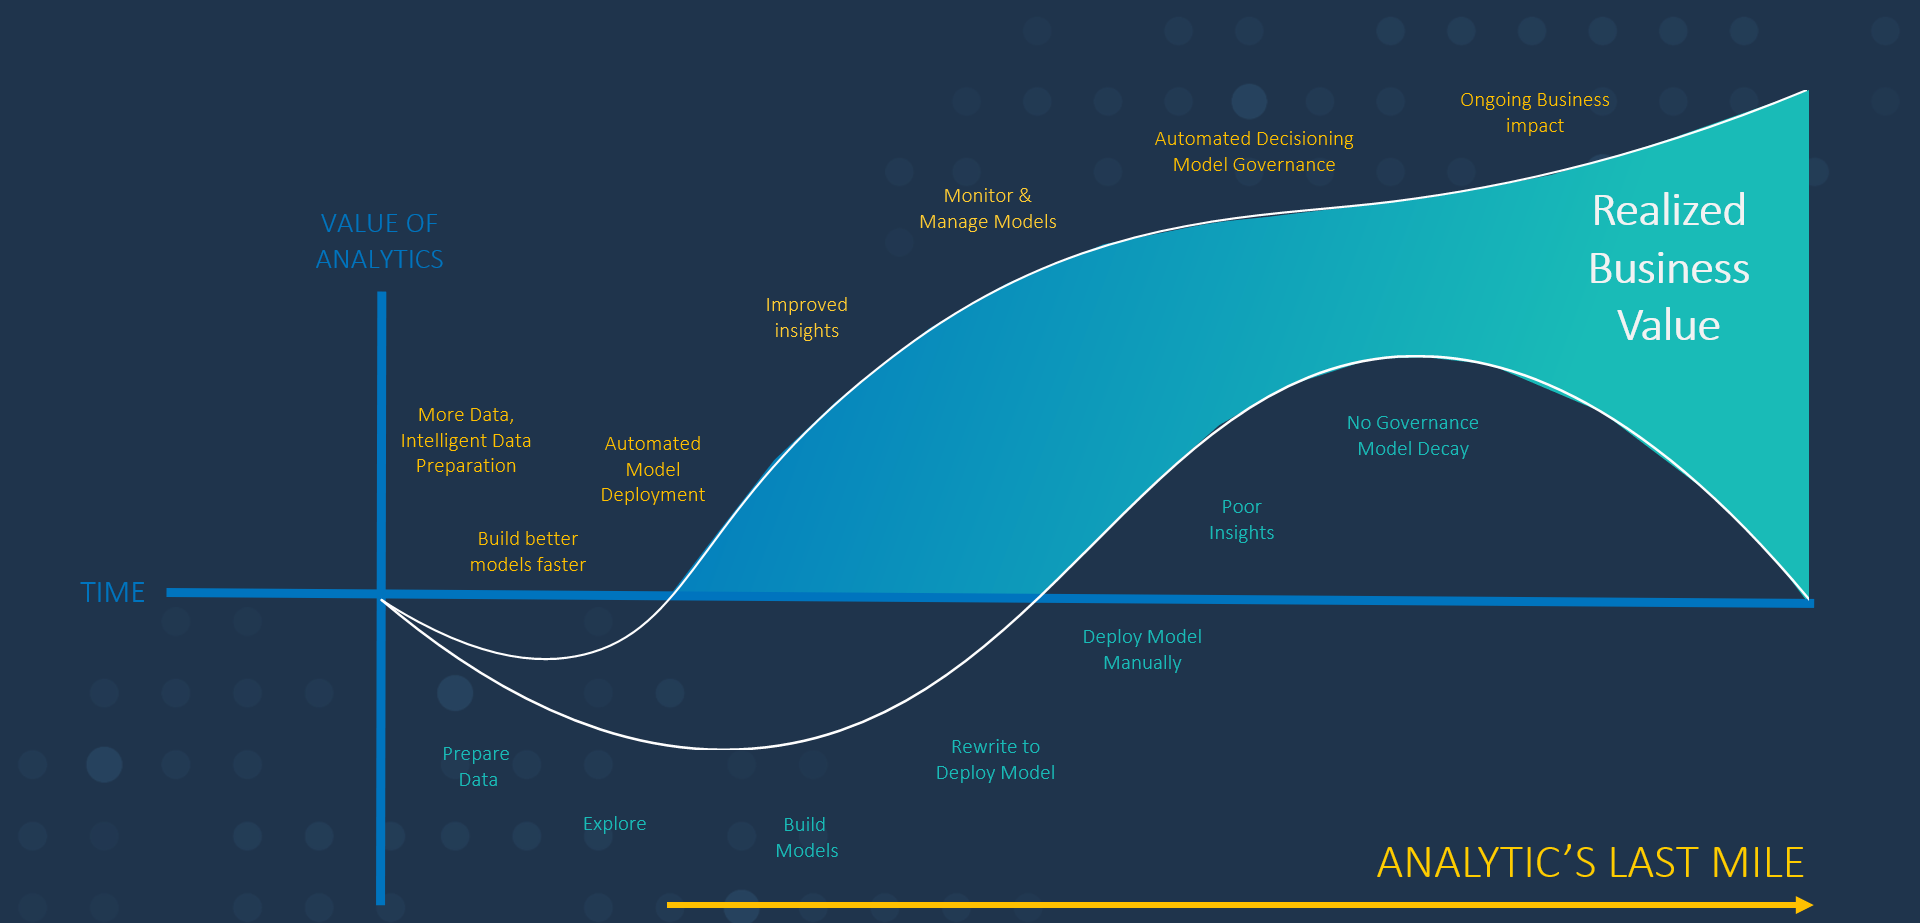
Transforming hype into reality for AI must focus on data, discovery, and deployment. Brands cannot survive on classroom science projects, and taking action enabled by AI-enhanced decisions completes the enviable last mile of embedding analytics into personalization strategies using experimentation and testing, recommendation systems, next-best-actions, attribution, segmentation, and journey optimization.
Going back to our segmentation example, let’s take a closer look at the influence of machine learning in the campaign management process. In Image 5 above, the last step of the segment mapping was the application of algorithmic clustering. But how were these clusters created?
Within SAS, analysts can perform artisanal modeling using programmatic or visual user interfaces. Given that customer behavior varies over time when thinking about segmentation, there isn’t one algorithm that rules them all. Users are offered a variety of techniques to select for both supervised and unsupervised approaches.
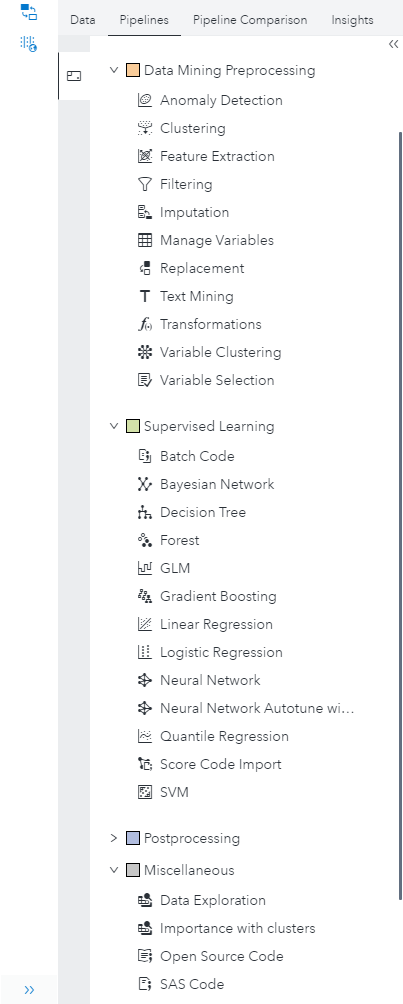
Clustering is a method of data segmentation that puts observations into groups that are suggested by the data. The observations in each cluster tend to be similar in some measurable way, and observations in different clusters tend to be dissimilar. Observations are assigned to exactly one cluster. From the clustering analysis, users can generate a cluster ID variable to tag customers for use in campaign management processes.
Let’s walk through a visual k-means clustering example that will transparently showcase how the results are derived and made available for SAS Customer Intelligence 360 to take advantage of.
The first step is to select the analysis object and drop it into the workspace.
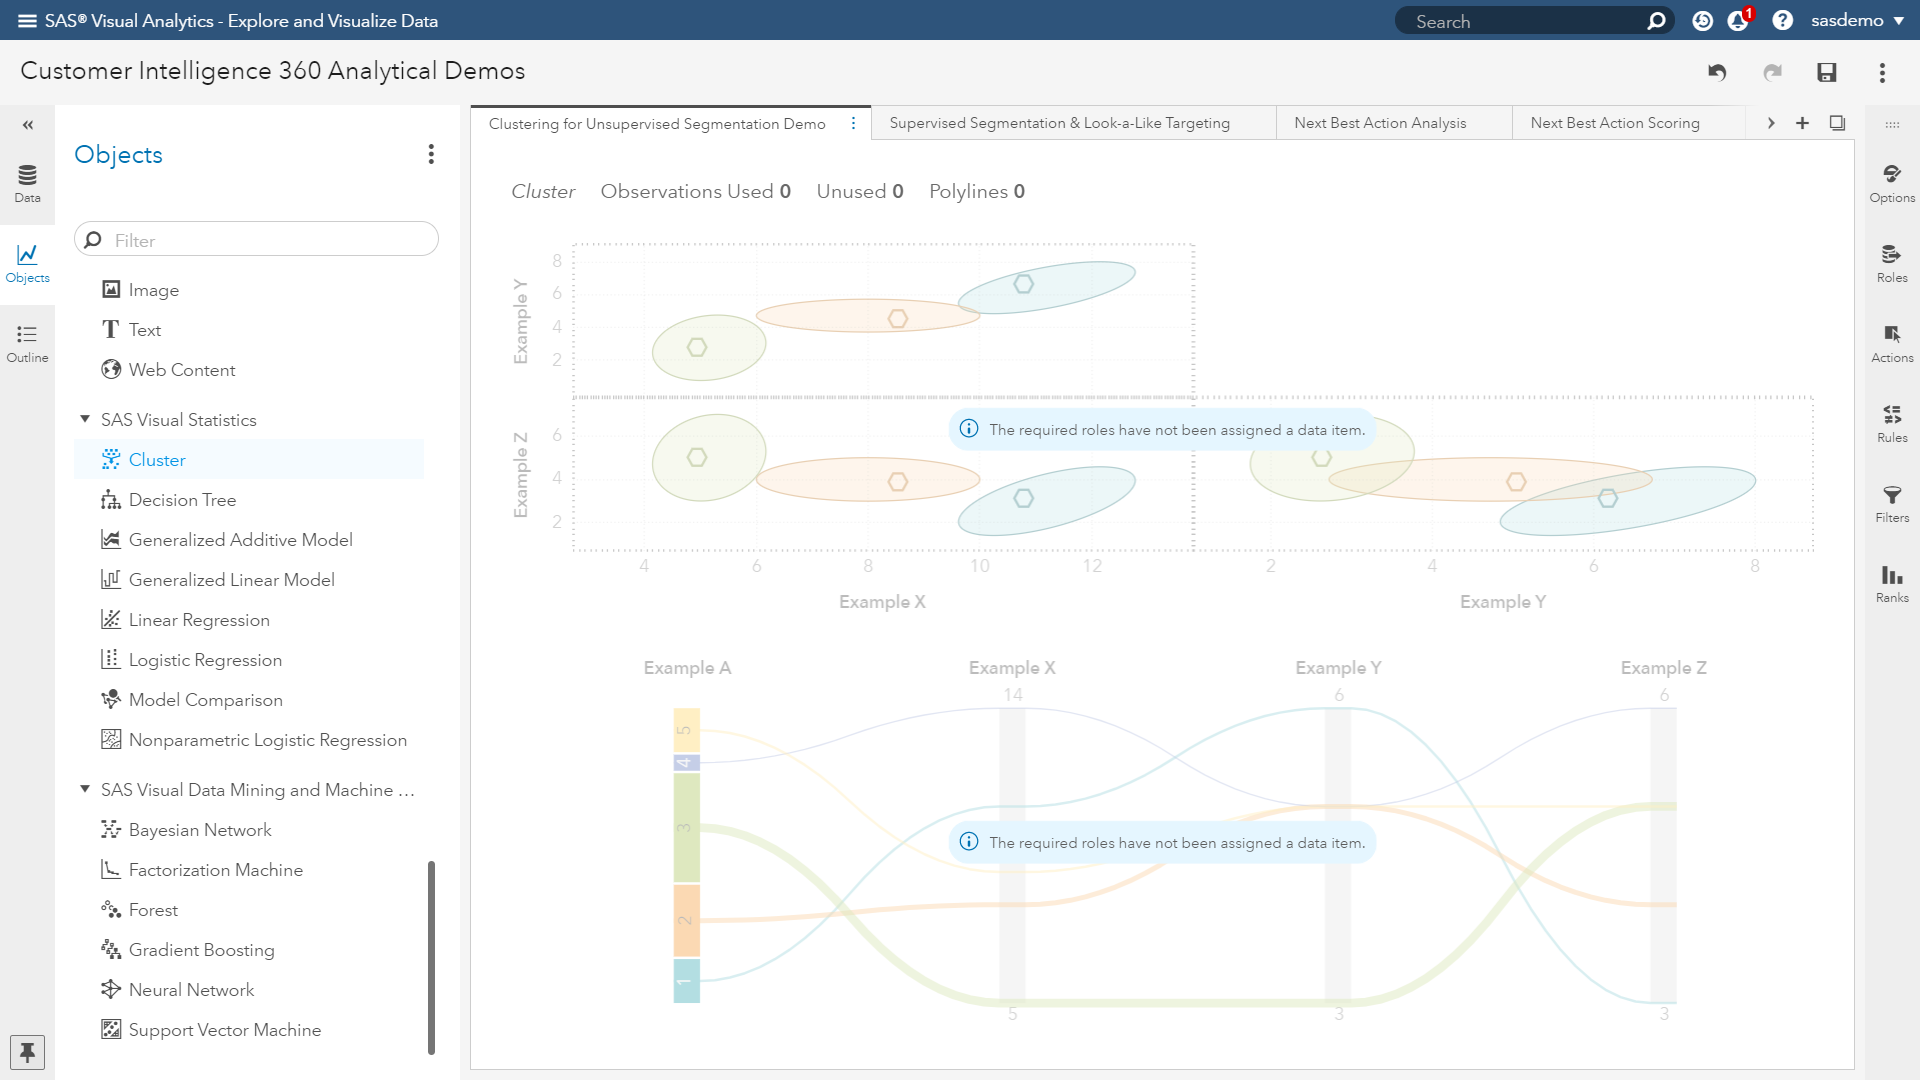
Next, users assign attributes to roles, customize model properties (if desired), and the model executes to provide results. In this example, the following attributes are fed into the analysis.
- Customer age
- Customer tenure (years)
- Mobile app sessions (last 30 days)
- Website visits (last 30 days)
- Email interactions (last 30 days)
The analyst wants to identify unsupervised synergies that help explain segment behavior across these online and offline signals. The results include two interactive visualizations worth highlighting.
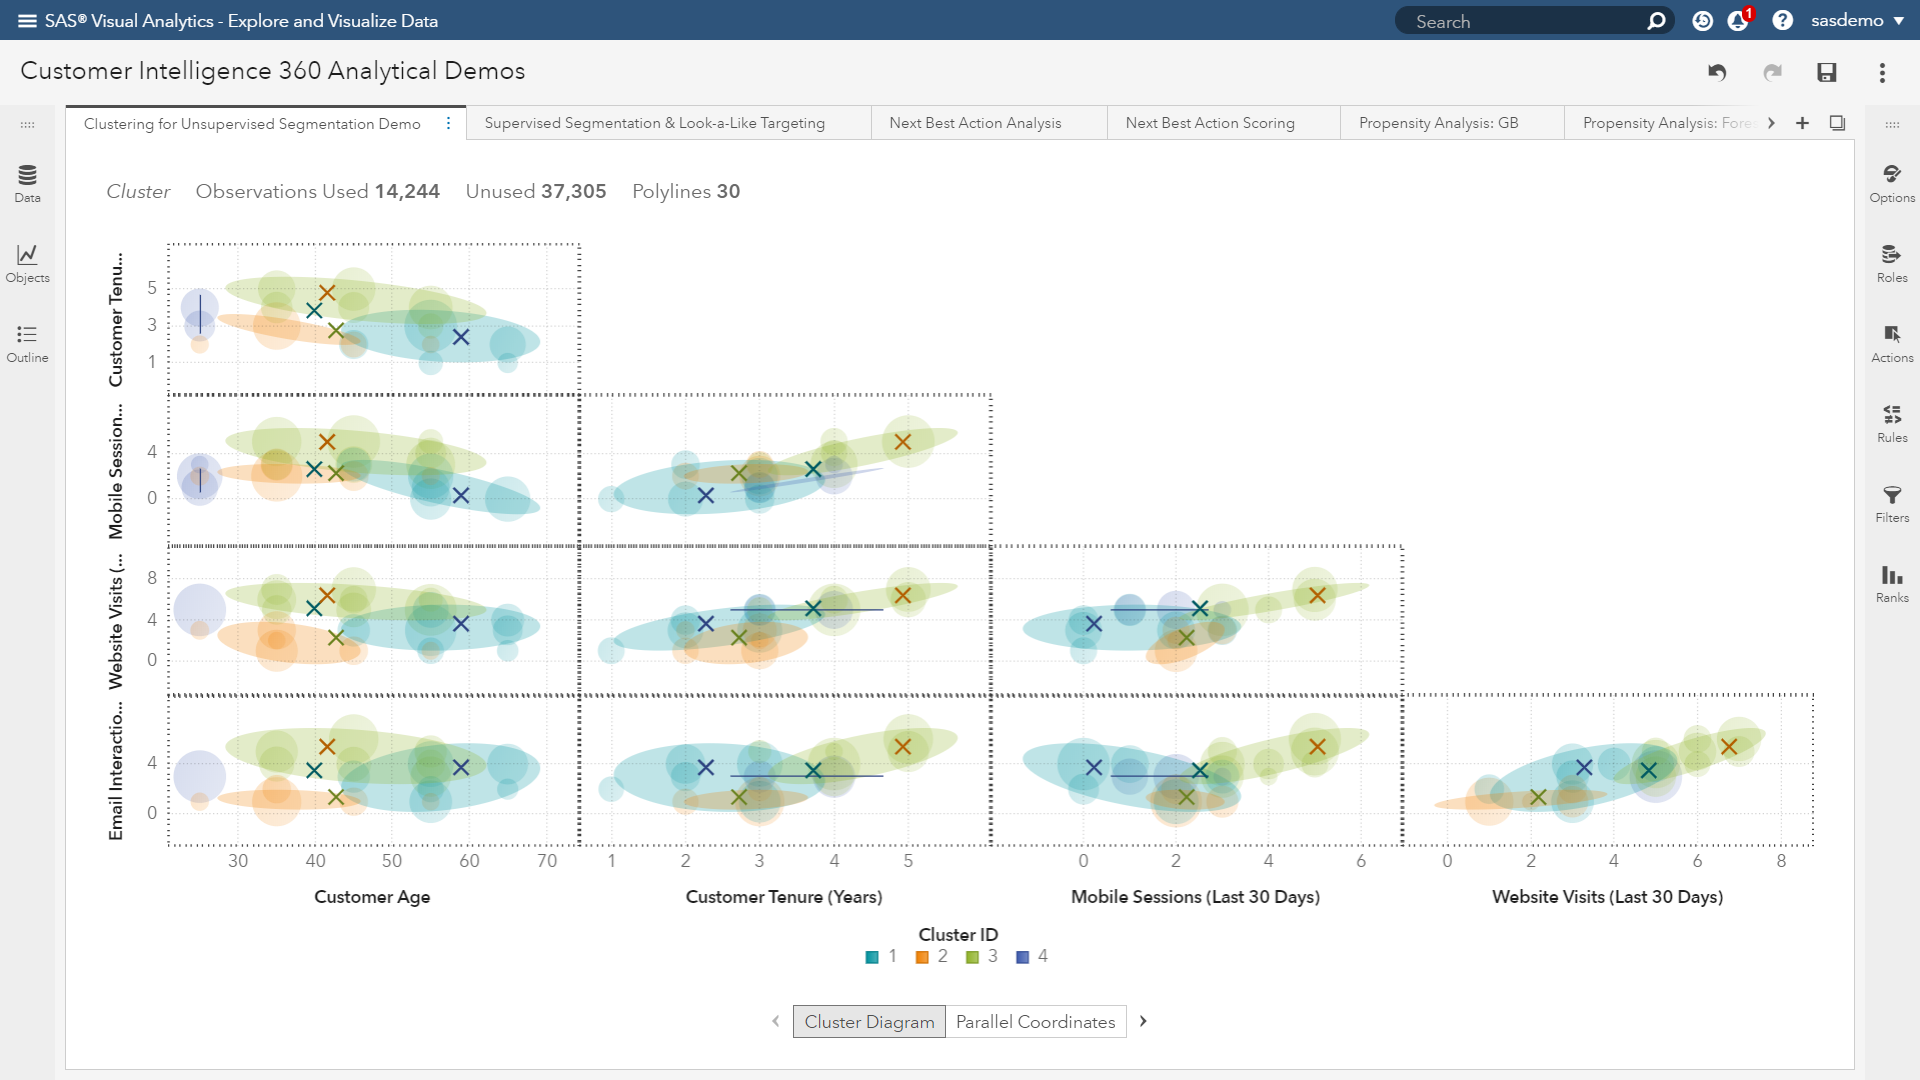
The cluster diagram (or matrix) displays a two-dimensional visualization of each cluster onto a specified number of effect pairs. These projections are useful for spotting cluster similarities and differences within the plots. Each cluster is assigned a unique color. Although each cluster is unique in n-space, the two-dimensional projections will overlap. It is important to note that every observation (or customer) can belong to exactly one cluster.
Interactivity with the diagram allows users to improve their understanding of any plotted effect pair.
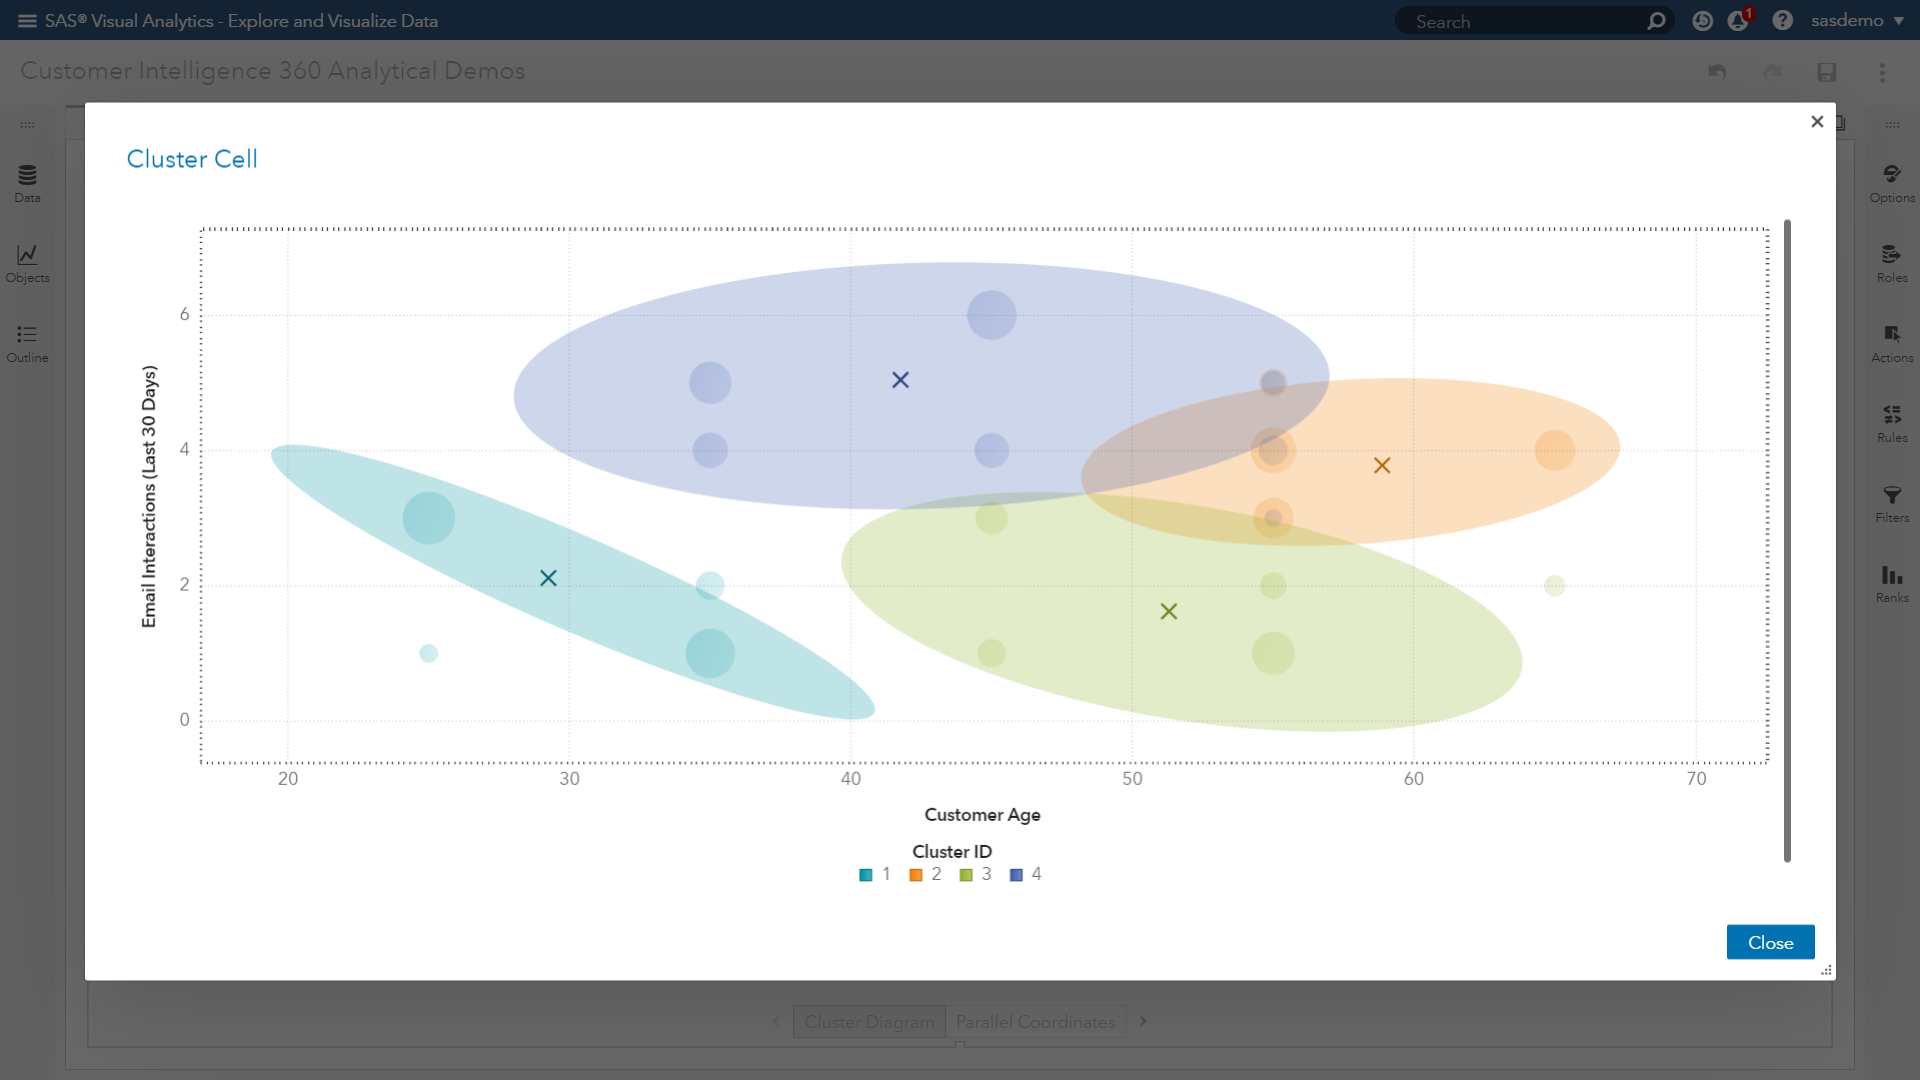
The interpretation of the relationship between customer age and the number of email interactions highlights that four unique segments exist, with two clusters displaying lower levels of engagement through this digital touchpoint. Users can hover over any centroid and obtain displays of each cluster’s mean values for the effect pair.
But what about the “data story” of each cluster? Let me introduce the parallel coordinates plot that enables users to accelerate the understanding of each cluster’s trends. The plot displays data as lines moving through categories and binned measures. The thickness of a line indicates the relative number of observations in that bin.
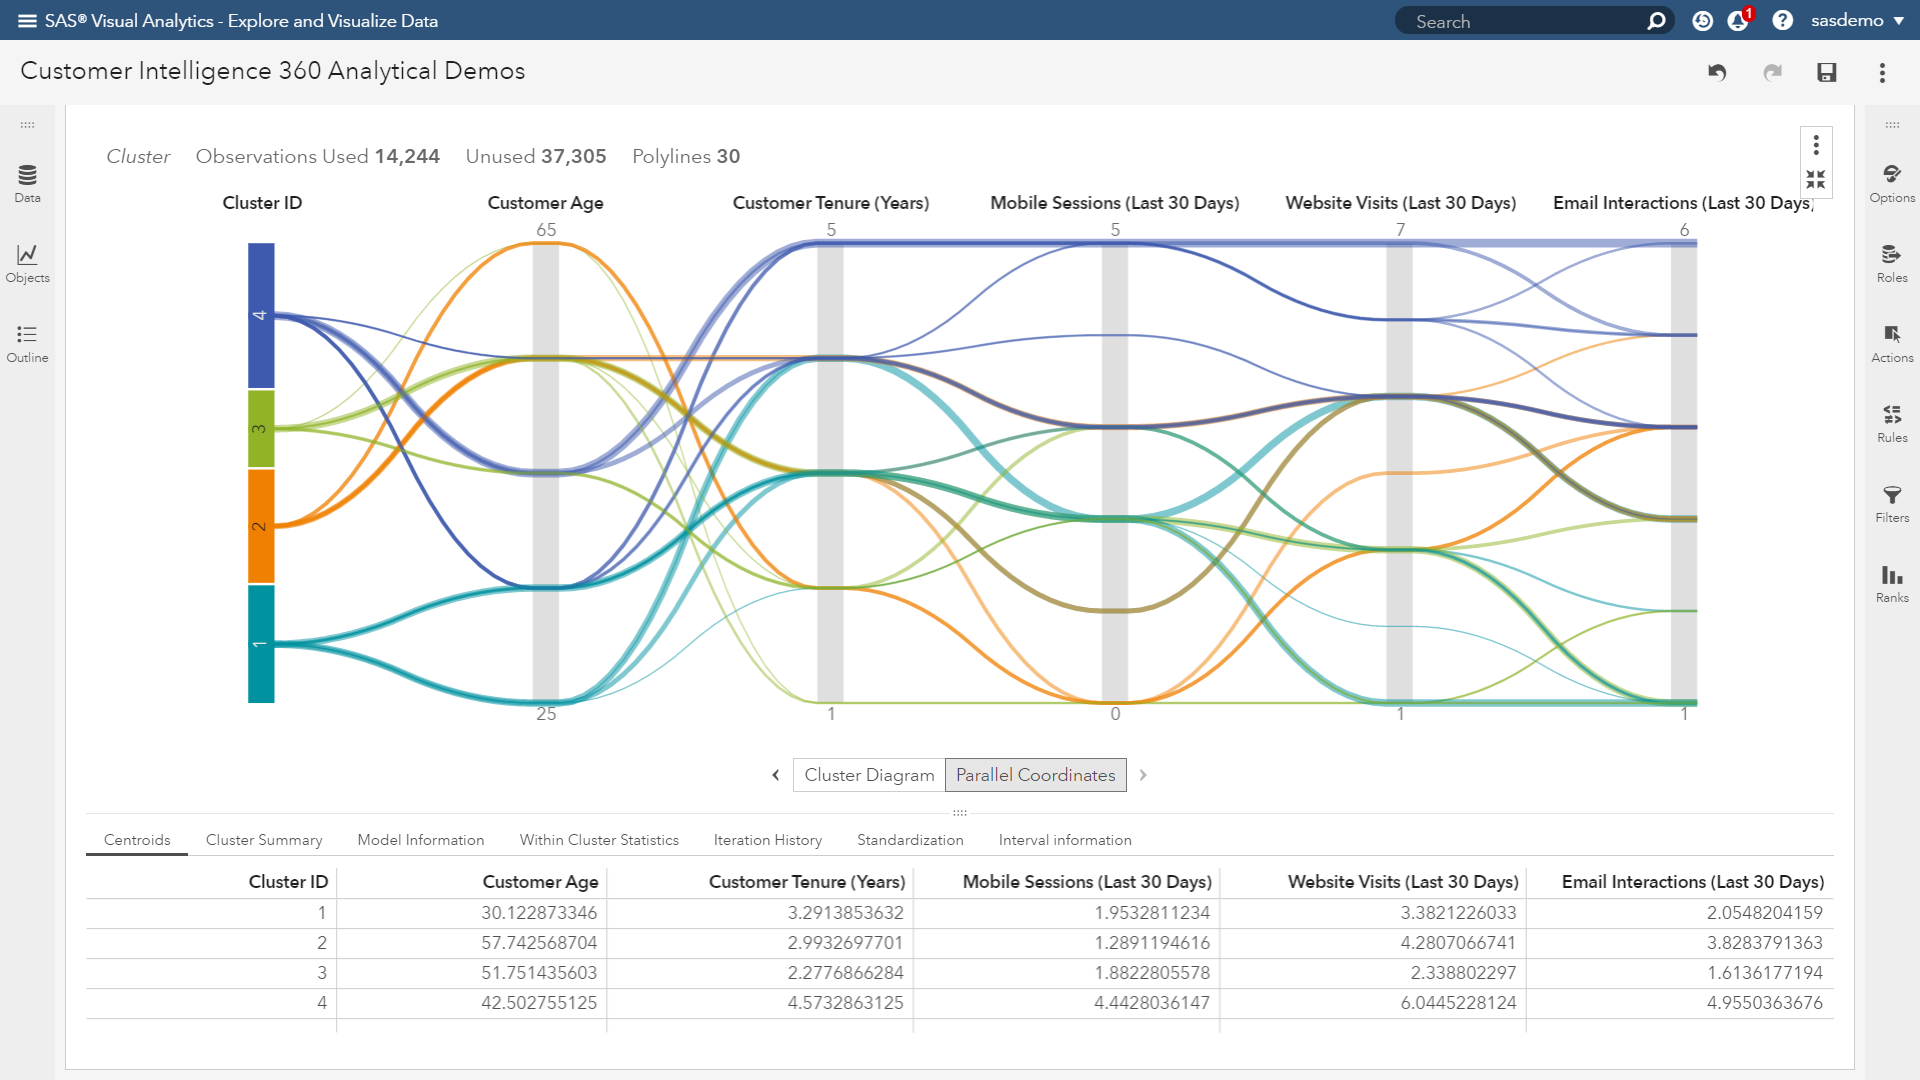
Wait a minute. This looks like spaghetti. How is this helpful?
Interactively, analysts can restrict the active lines to one or more bins in order to focus on only the data that interests them. In addition, users can adjust the plot to explore the data based on cluster membership, a specified range for one or more variables, or both.
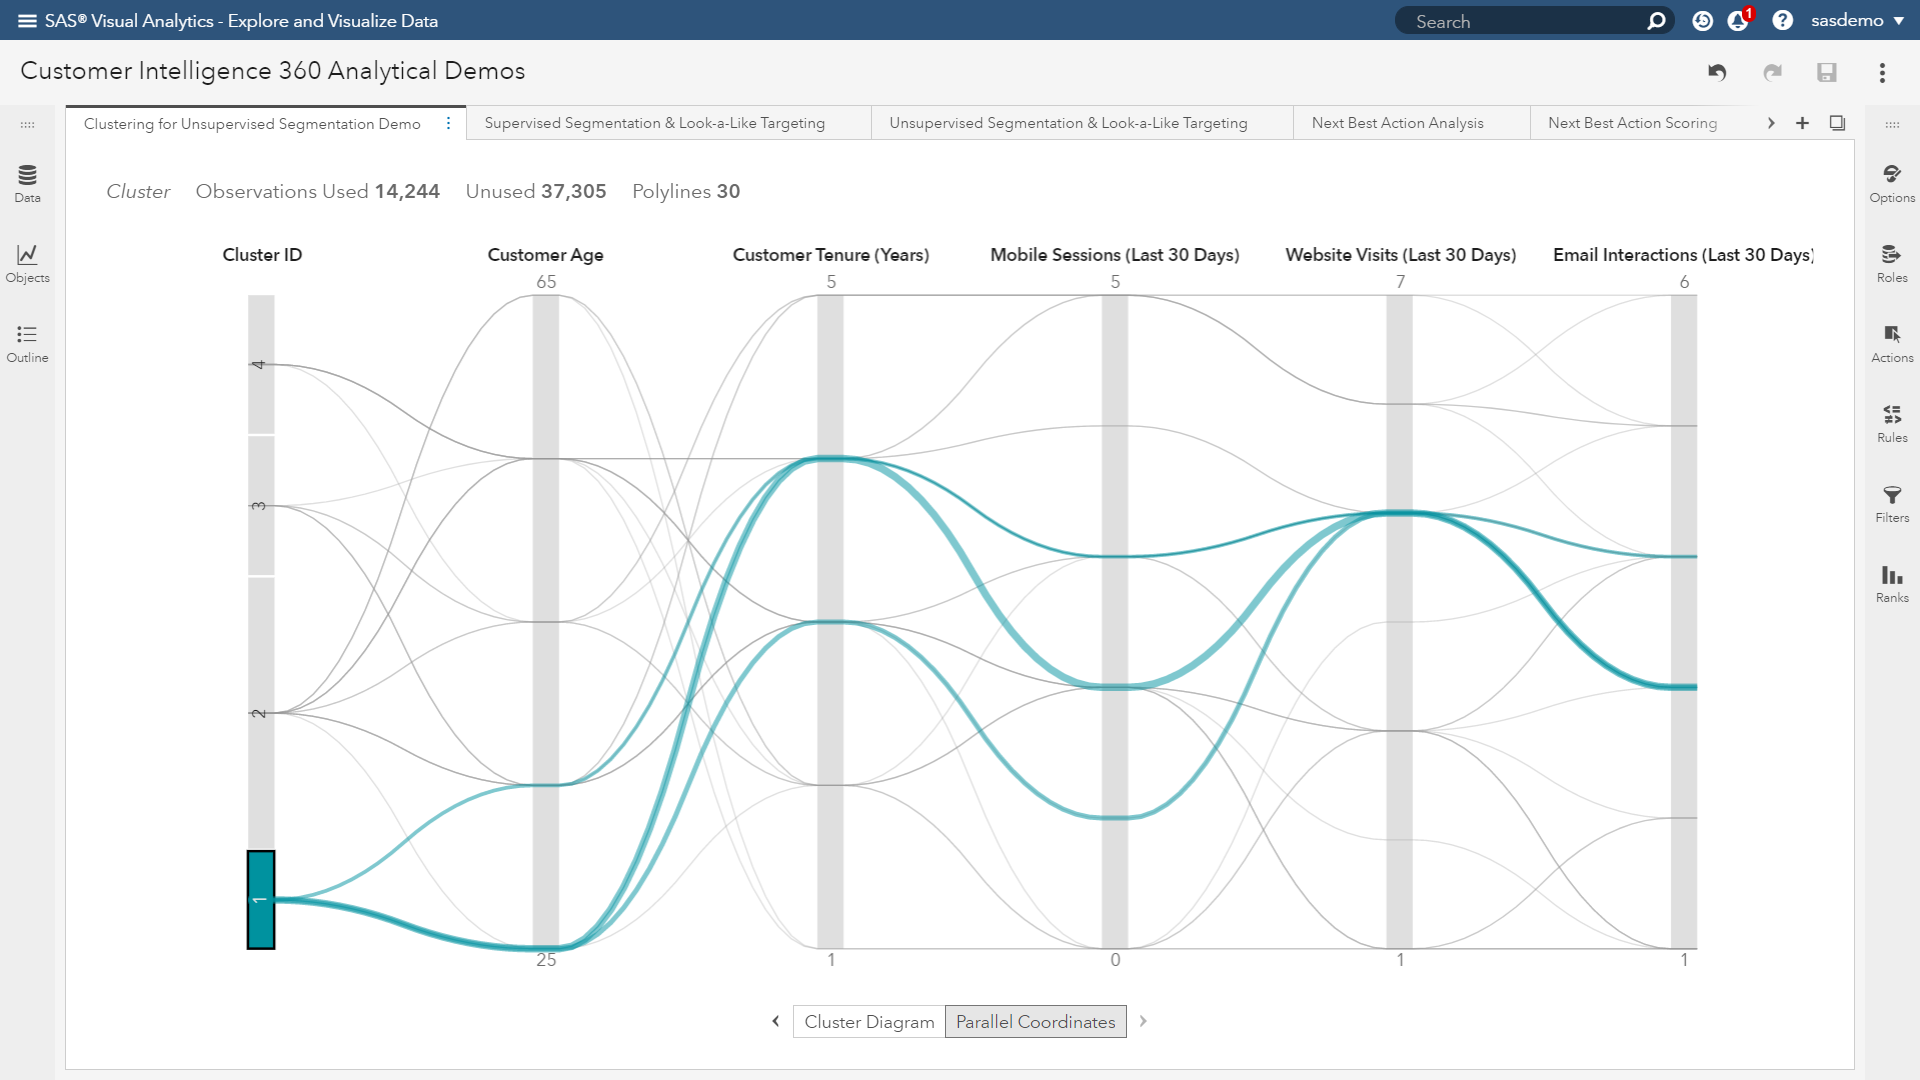
A single click with the visual plot allows the user to focus on Cluster 1. The interpretation (or story) is this group skews younger, moderate tenure, and low to medium engagement levels across web, mobile, and email touchpoints.
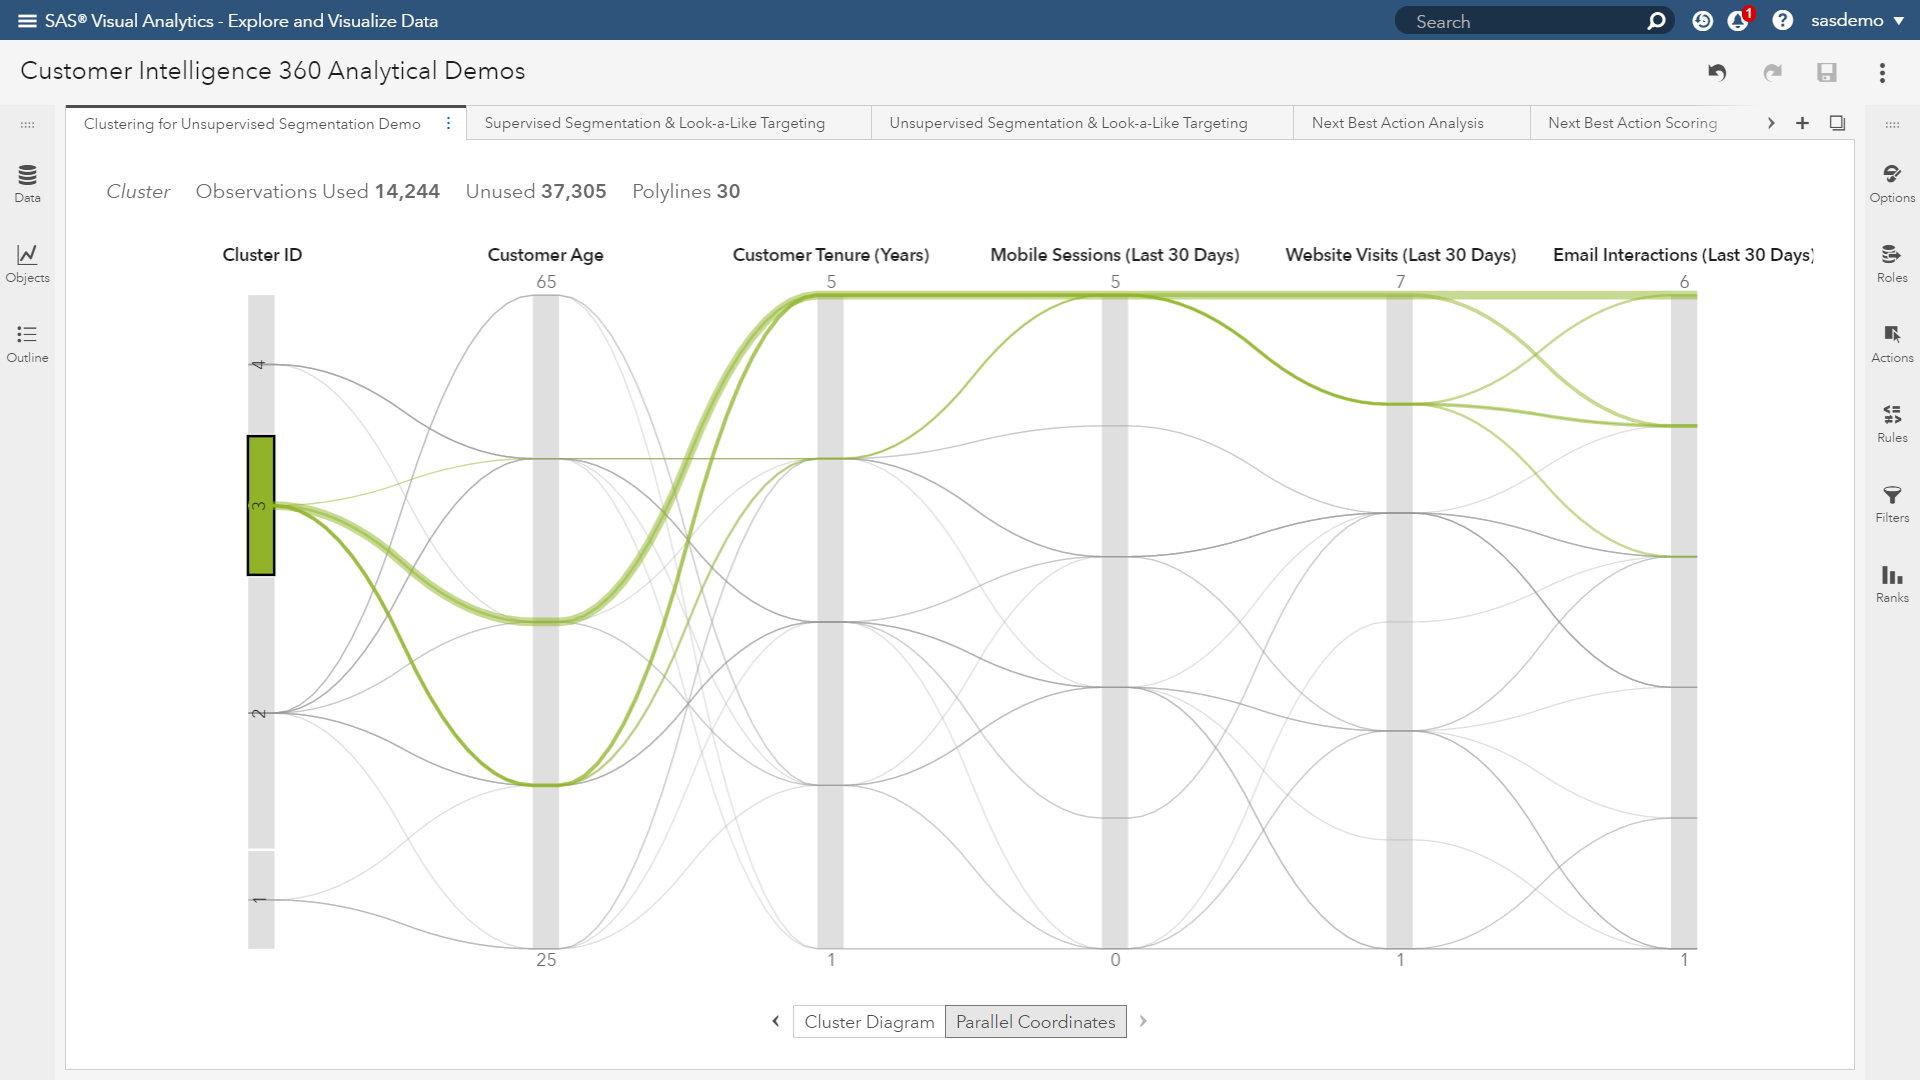
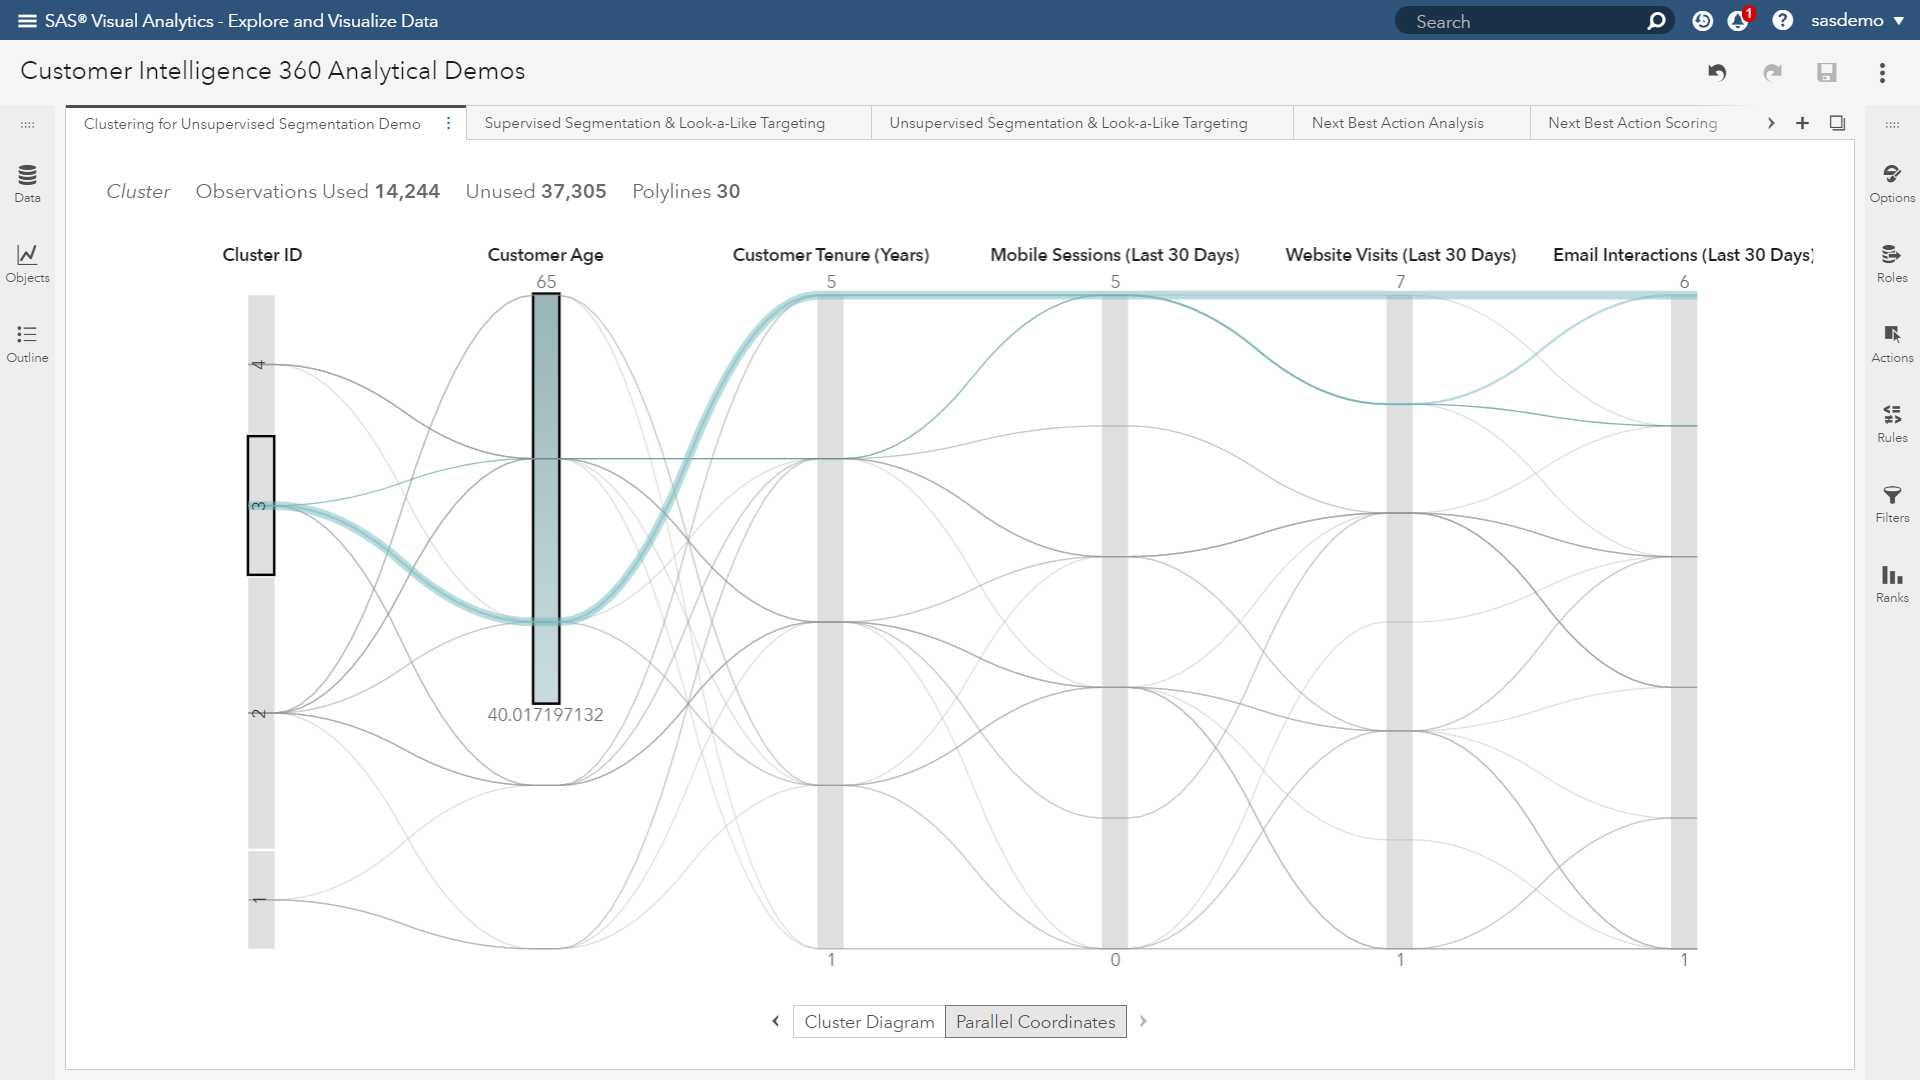
Another click leads the user to focus on Cluster 3. The interpretation here is a group aged 35-45 years, and high values of tenure and digital touchpoint engagement. The interactivity doesn’t end there, as a selection of the vertical bar representing age distribution, and the analyst can further filter on customers 40 years of age or greater.
Takeaways
Hybrid marketing, as a method of approach, combines both direct and digital marketing capabilities in one platform. Part one of this blog series covered what hybrid marketing is, how it works, and where analytics fits into the discipline.
In part two, we'll conclude on presenting a practitioner-oriented example of the analytical last mile, and how that applies to the multi-channel orchestration of customer journey management.

1 Comment
Pingback: SAS Customer Intelligence 360: Hybrid marketing and analytic's last mile [Part 2] - Customer Intelligence Blog