Why does your organization’s website or mobile app exist? What are you hoping to accomplish with your business by being digital? What are the most important priorities for your digital presence?
Here are three goals that most organizations share:
- Sell more stuff.
- Make marketing more effective.
- Delight customers.
Goals are specific strategies leveraged to accomplish business objectives. Let’s walk through one of the examples cited above.
What does sell more stuff actually mean?
- Do x (more cross-sell or upsell efforts).
- Improve y (increase conversion rates).
- Reduce z (reduce abandon cart rates).
Every brand offers a digital experience for a reason. The primary objective of a website or app is commonly referred to as a macro goal. Simply put, someone completes an action that is important to your business (like making you some money). However, brands typically exist online for more than one reason. These secondary objectives are called micro goals. Think of them as indicators that a visitor is moving towards a macro goal (like progressing through a multi-step sales funnel to eventually make you some money).
Propensity models and SAS Customer Intelligence 360
Propensity models are what most people think about with predictive analytics and machine learning. These models help predict the likelihood of a certain type of customer behavior. In digital analytics, propensity scoring for visitors to your website or app can be extremely powerful in helping meet your macro and micro goal targets.
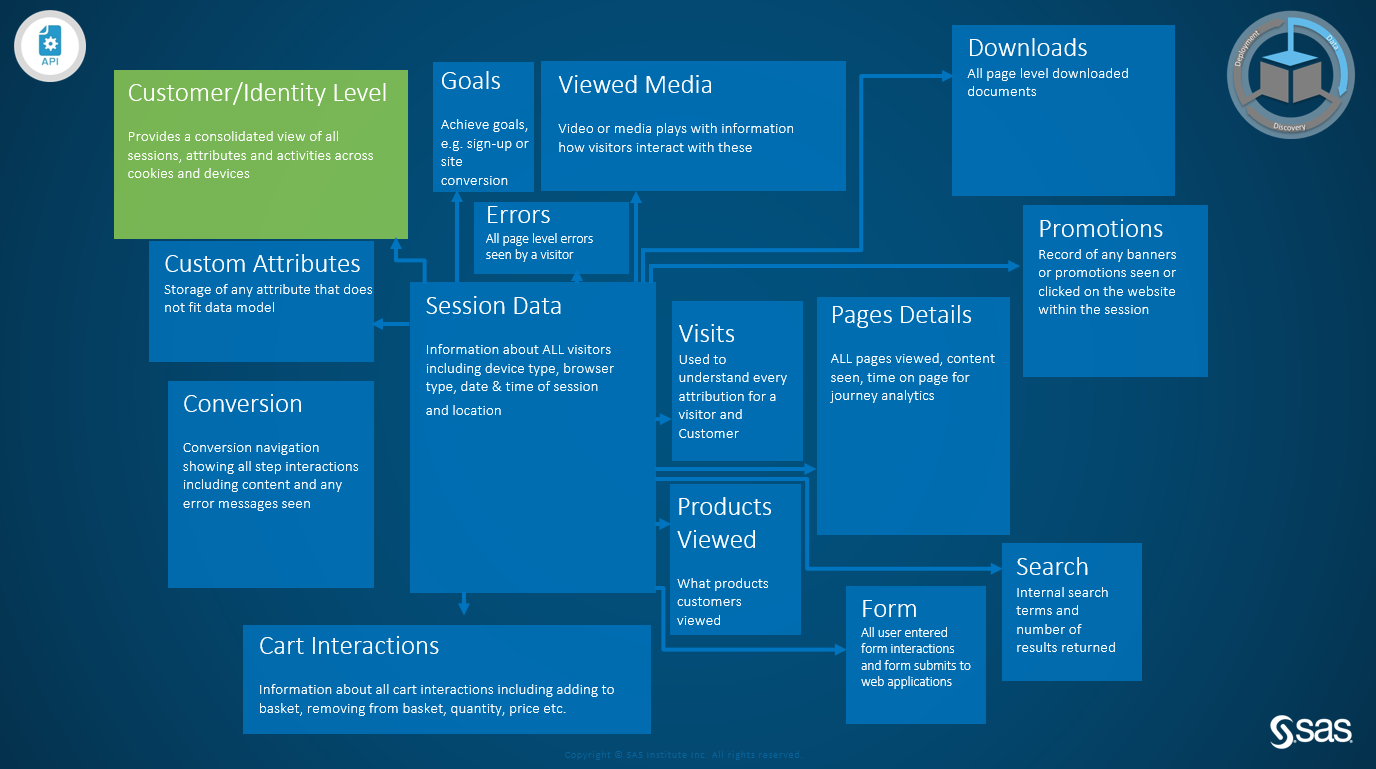
Leveraging data collection mechanisms, SAS 360 Discover captures first-party behavioral information across the entire digital customer experience with a brand’s websites and apps. As visitor journey data flows in, SAS transforms that valuable information into structured views, allowing an analyst to build sophisticated propensity models using SAS Viya.
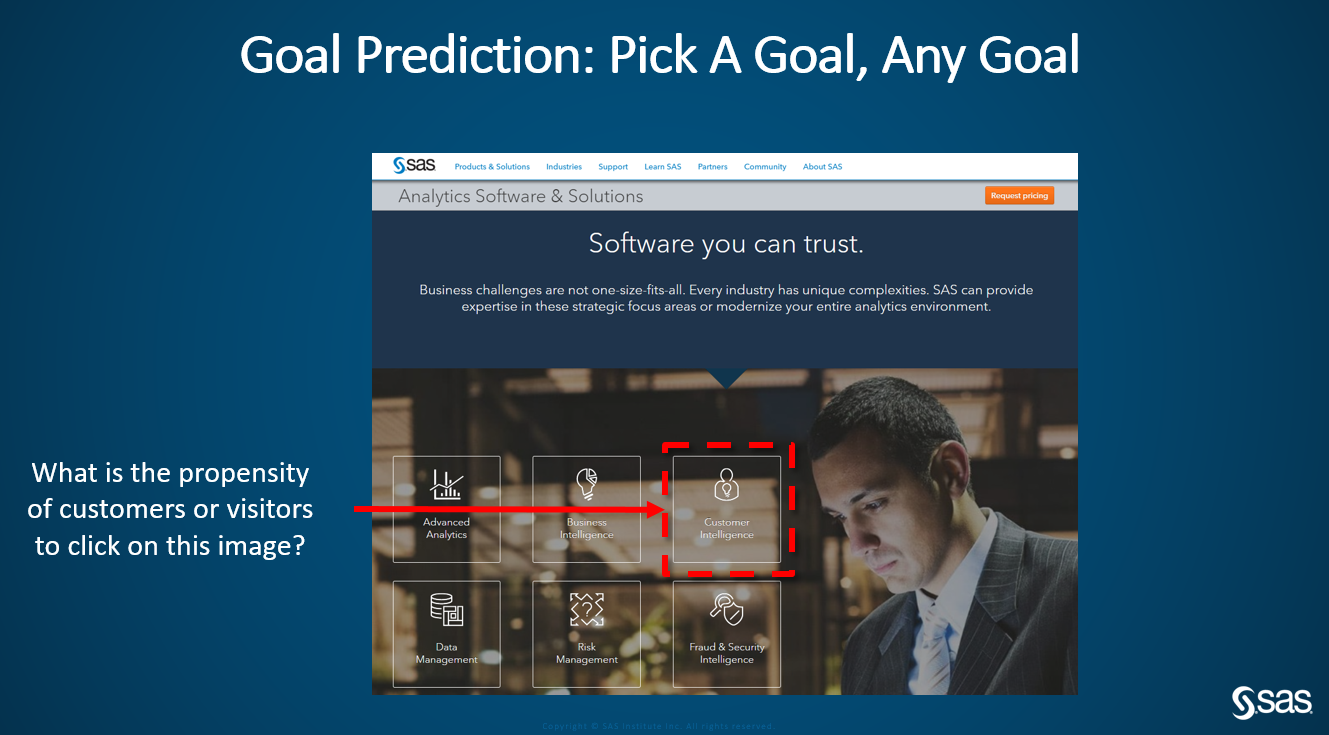
I want to be very clear. Users can pick any goal to base their propensity models on. Clicking a button, viewing a video, downloading content, purchasing a product or deepening engagement - all are fair and applicable ideas for defining your model’s target (or dependent) variable.
Does that sound tasty and refreshing? Let’s begin by sharing a high-level blueprint of propensity modeling with Customer Intelligence 360. There are three key stages:
- Data.
- Discovery.
- Deployment.
Stage one: Data
As semi-structured raw data flows in from your brand’s digital properties, the SAS 360 Discover data model gets to work. The structured output provides a variety of aggregated tables of digital interactions flattened for propensity modeling.
Imagine the possibilities - users can select structured digital data from a SAS library to build analyses for:
- Identifiable traffic and next-best-action targeting.
- Anonymous traffic and macro/micro goal targeting.
- A/B testing and audience qualification.
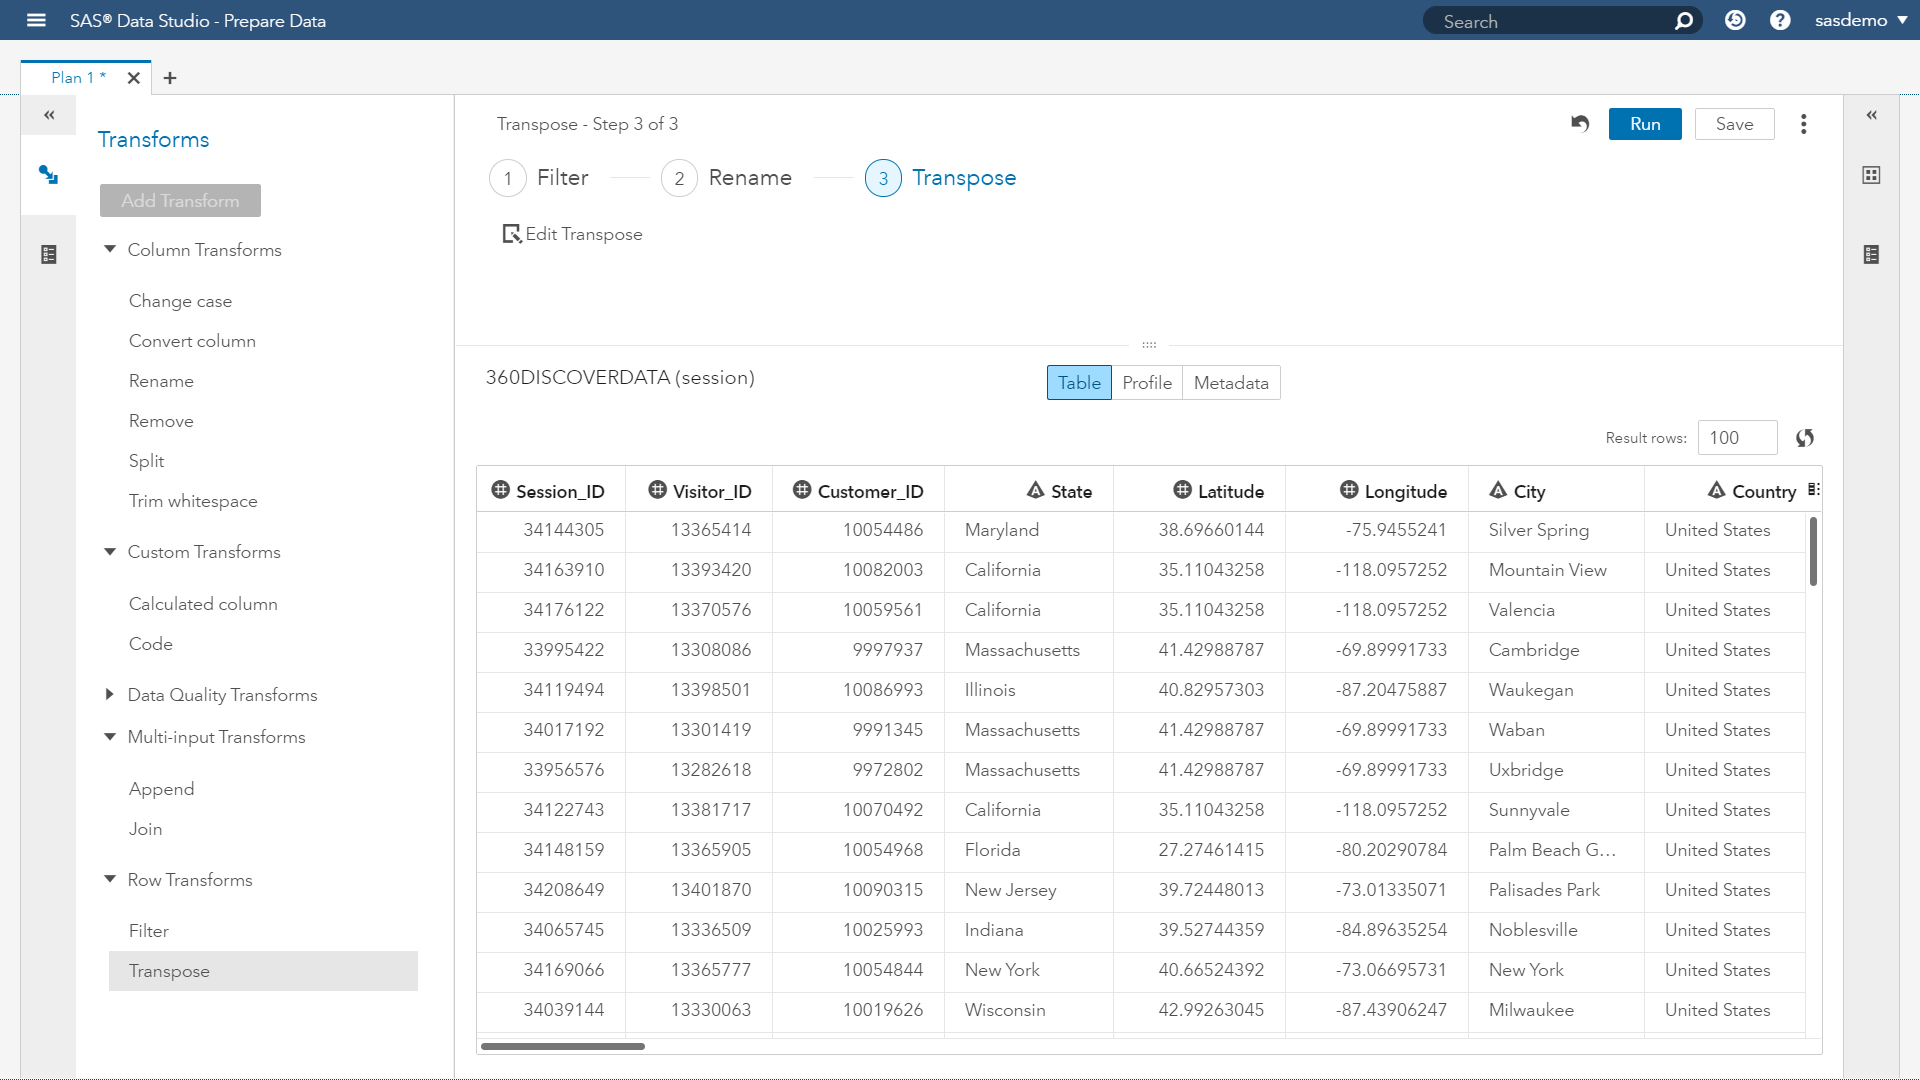
There are other use cases, but my intent is to get your wheels grinding with ideas. Getting back to customizing your data, users can join online data with offline and third-party sources, treat data quality issues, transpose columns into zero-one predictors and engineer features to your heart's content.
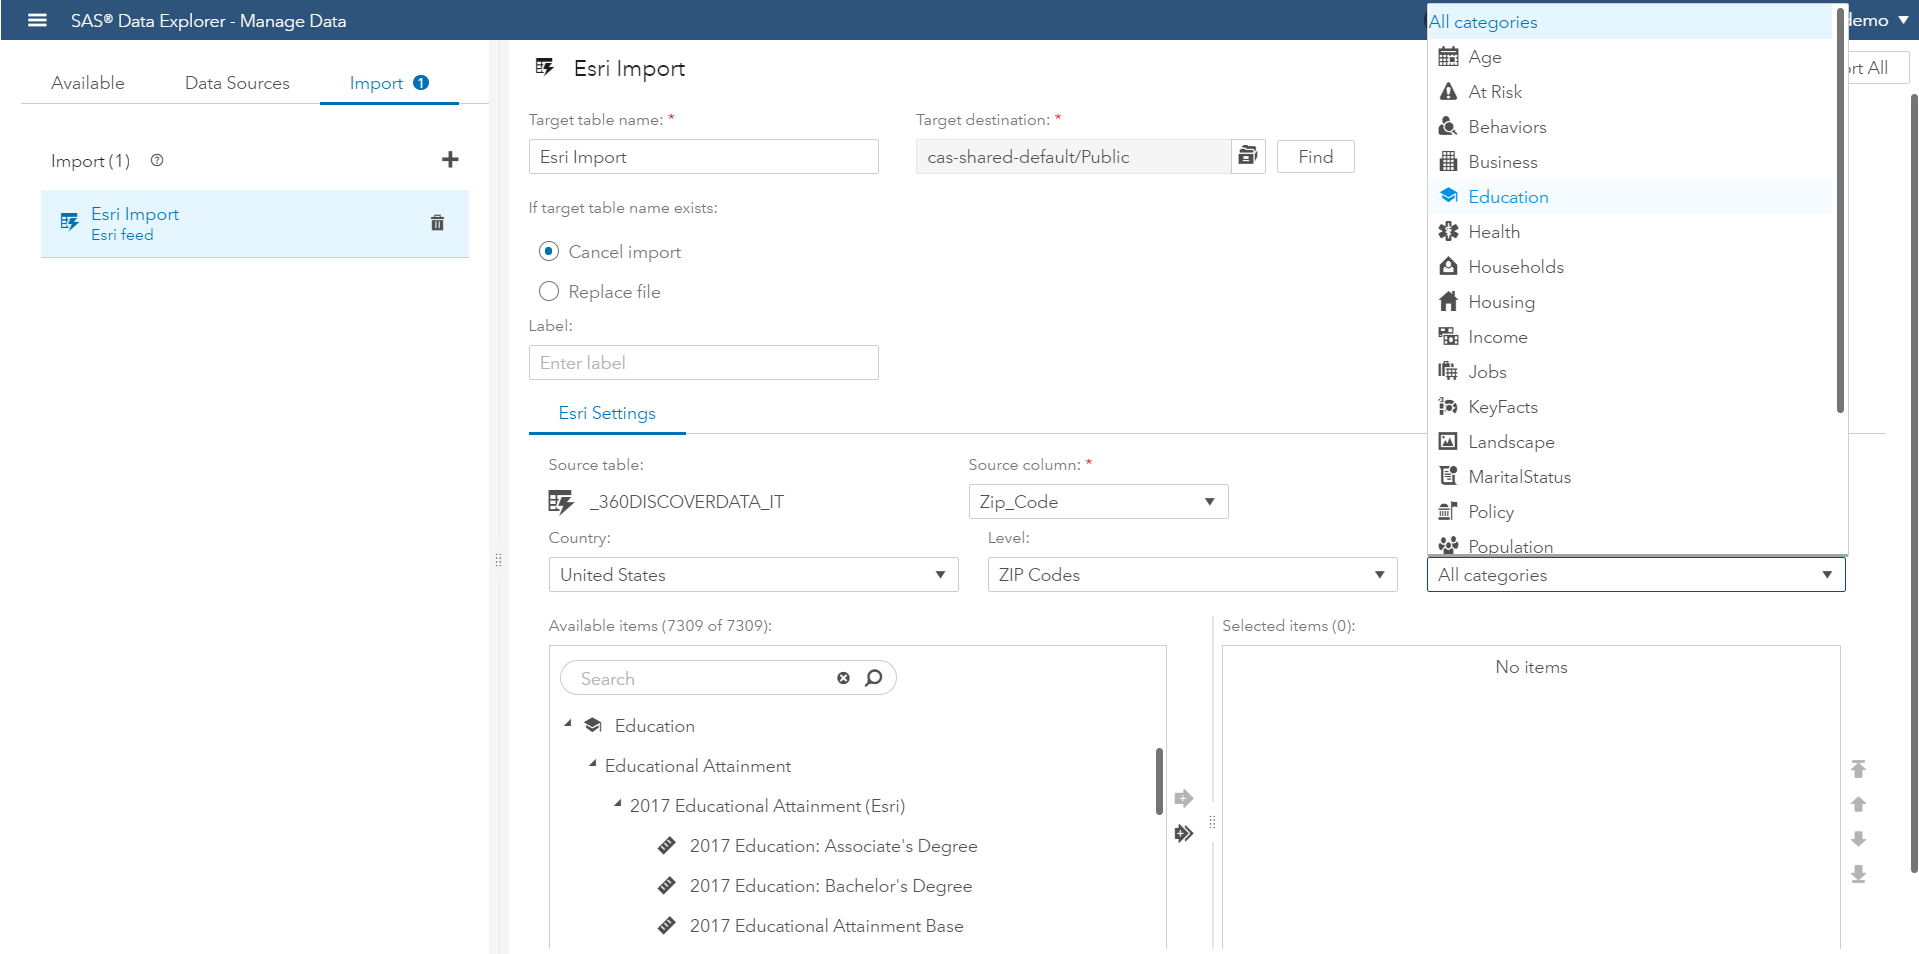
Prefer point and click? We got your back. Love to code? We didn’t forget about you either. Desire to decorate your digital journey data with third-party attributes? No problem with our ESRI integration.
SAS empowers the art of data preparation as we appreciate the importance of this within propensity modeling as a differentiator between average vs. game-changing analyses. Watch a demo of using SAS to profile data. This second video highlights preparing and transforming data into a user’s desired format.
Stage two: Discovery
Once your data is ready, SAS enables users to perform exploratory visualization and artisanal modeling. Given that customer behavior varies based on the marketing use case, users are offered a variety of algorithms.
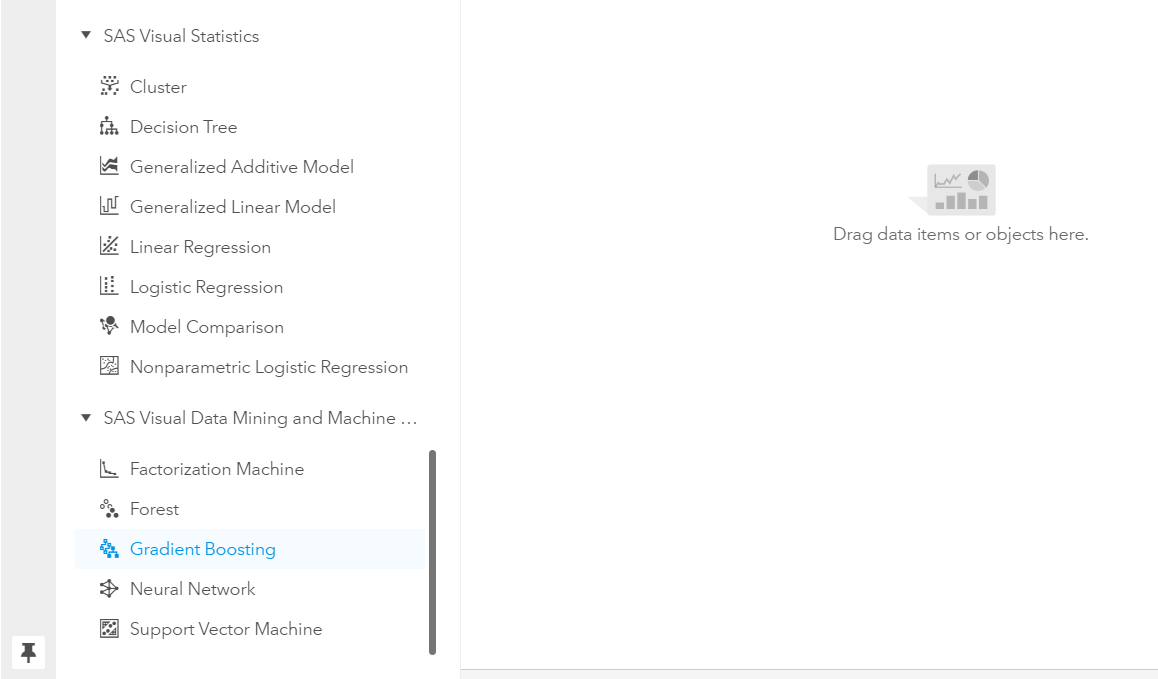
Working with analysis objects is similar to creating a visualization. Users select the object, drop it into the work space, assign attributes to roles and the model executes to provide results. For this example, I would like to build three machine learning models and select the algorithm that provides the best results.
The first model will use gradient boosting. Leveraging SAS PROC GRADBOOST, the application is primarily for building classification models on large datasets. Macro and micro goals for digital experiences perfectly fits this algorithm’s use case. Gradient boosting uses decision tree modeling by generating many trees sequentially from slightly different subsamples of the training data. It then takes the results from the trees and averages them.
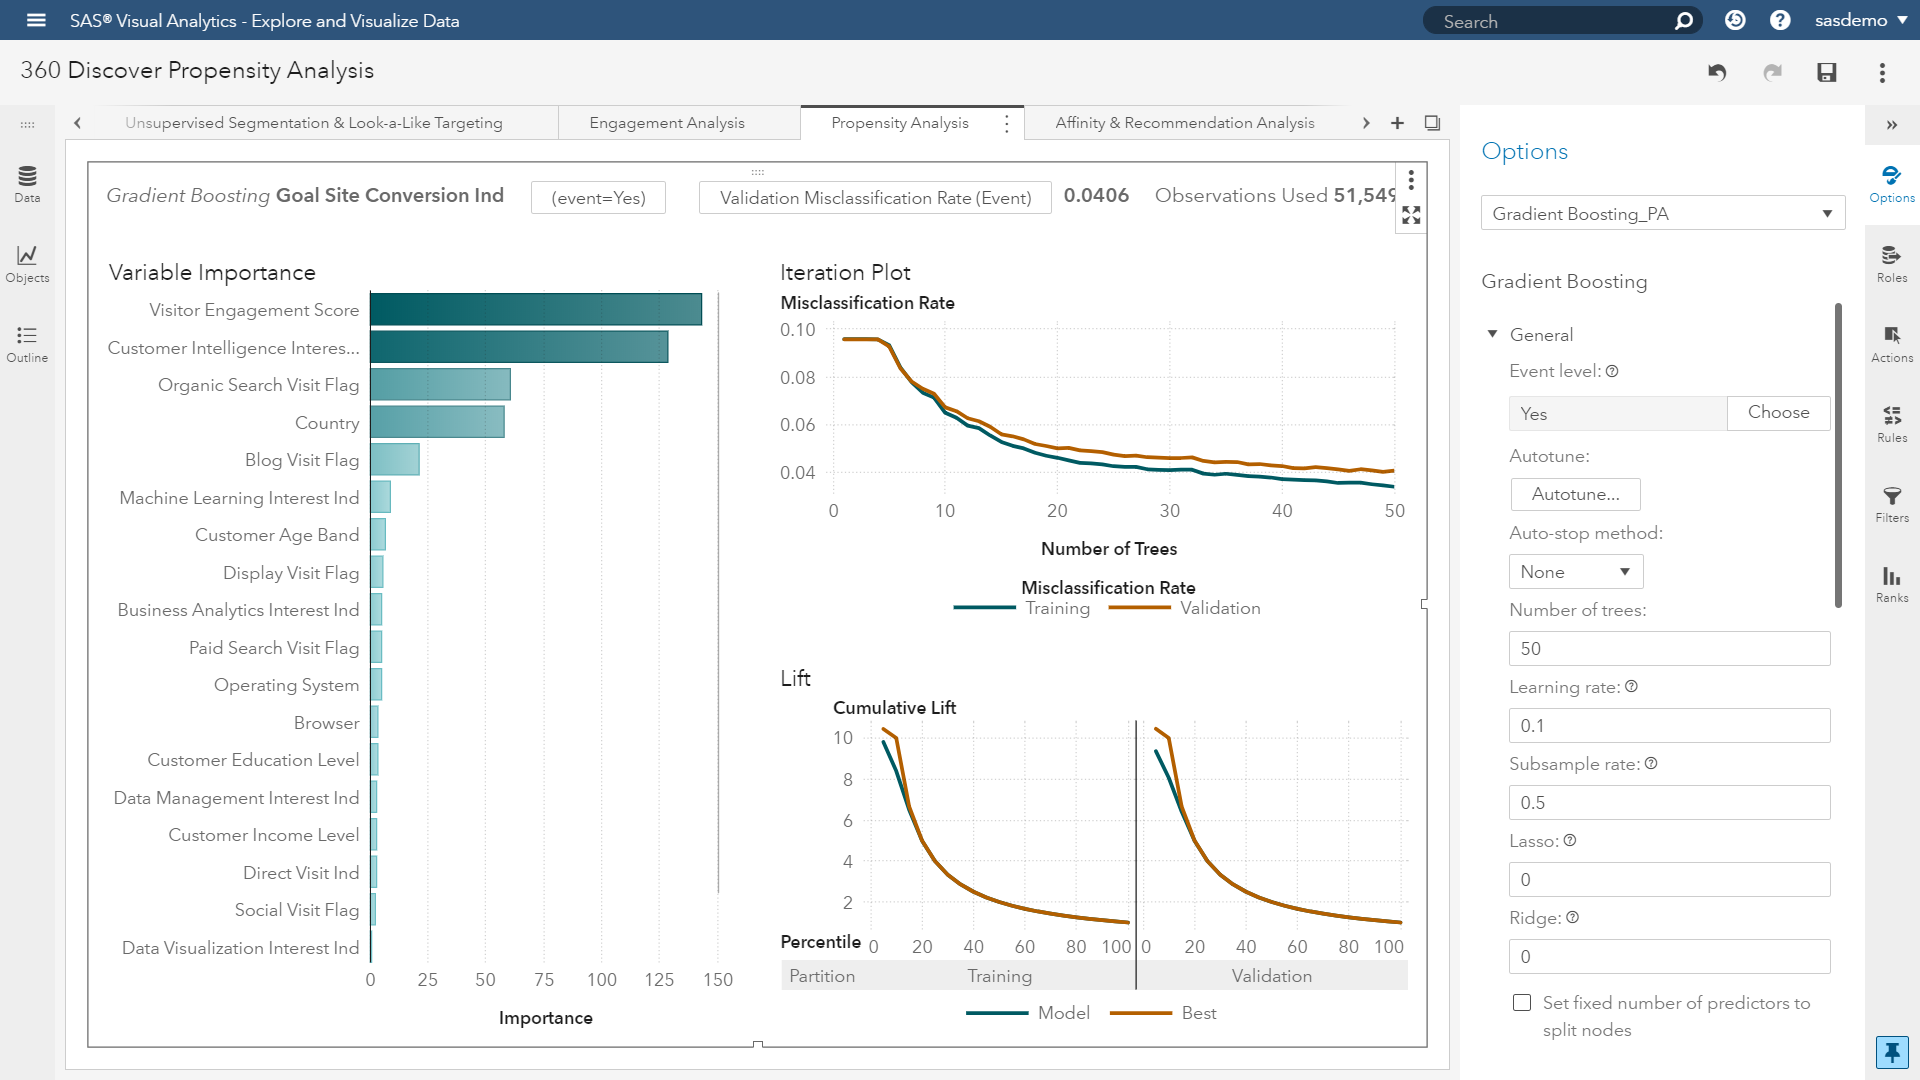
Watch an introductory video of building Gradient Boosting models in SAS. For advanced users who appreciate techniques like hyperparameters and model tuning, check out this demo.
The second model will use forests. Leveraging SAS PROC FOREST, the application is similar to gradient boosting for building classification models. It also uses decision tree modeling, however it generates many trees simultaneously from slightly different samples of the training data. Although the difference in approaches seems subtle, the predictions can vary. Note our objective in model building is to create predictions that can fit new data and generalize well. Good generalization is the primary goal for predictive tasks.
Building the forest model is pleasantly easy. Because I want an apples-to-apples comparison with the first model, SAS gives me a one-click option to duplicate the effort using a different algorithm.
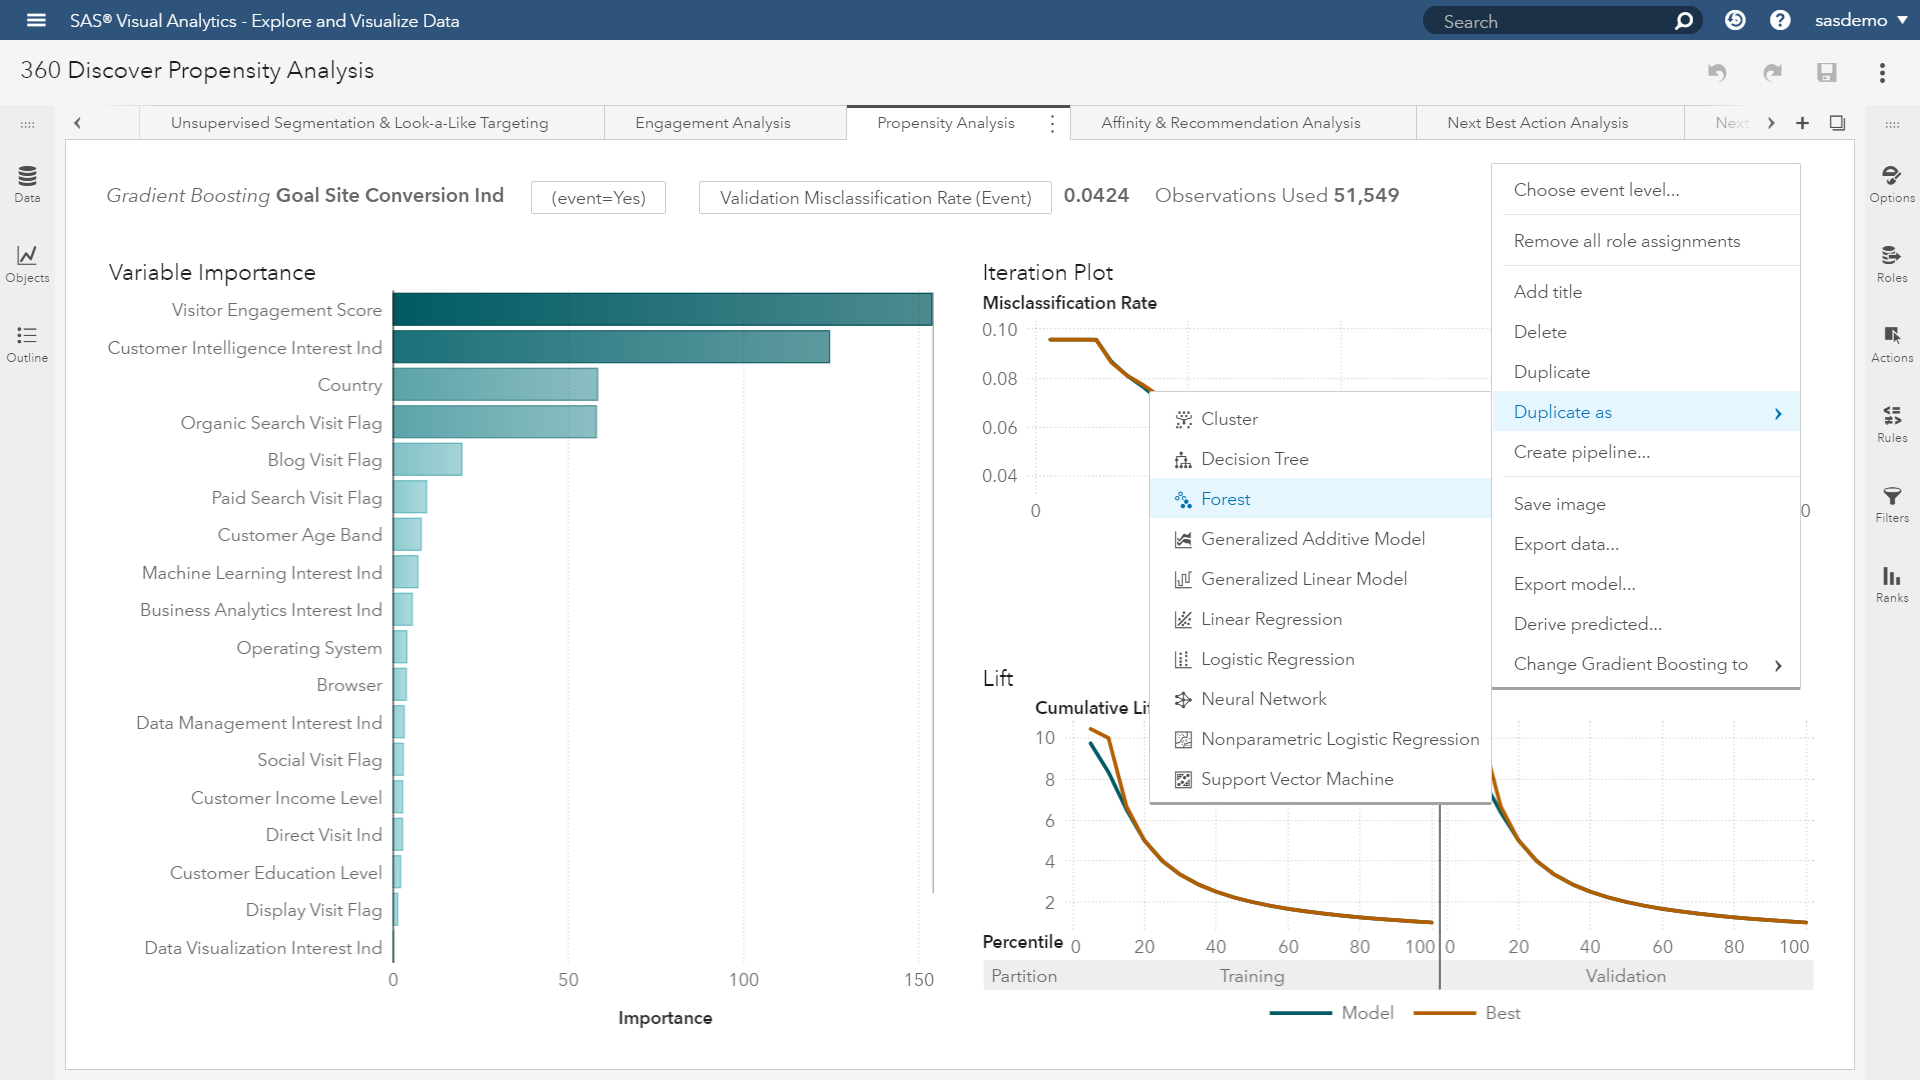
A few moments later, users are presented the results.
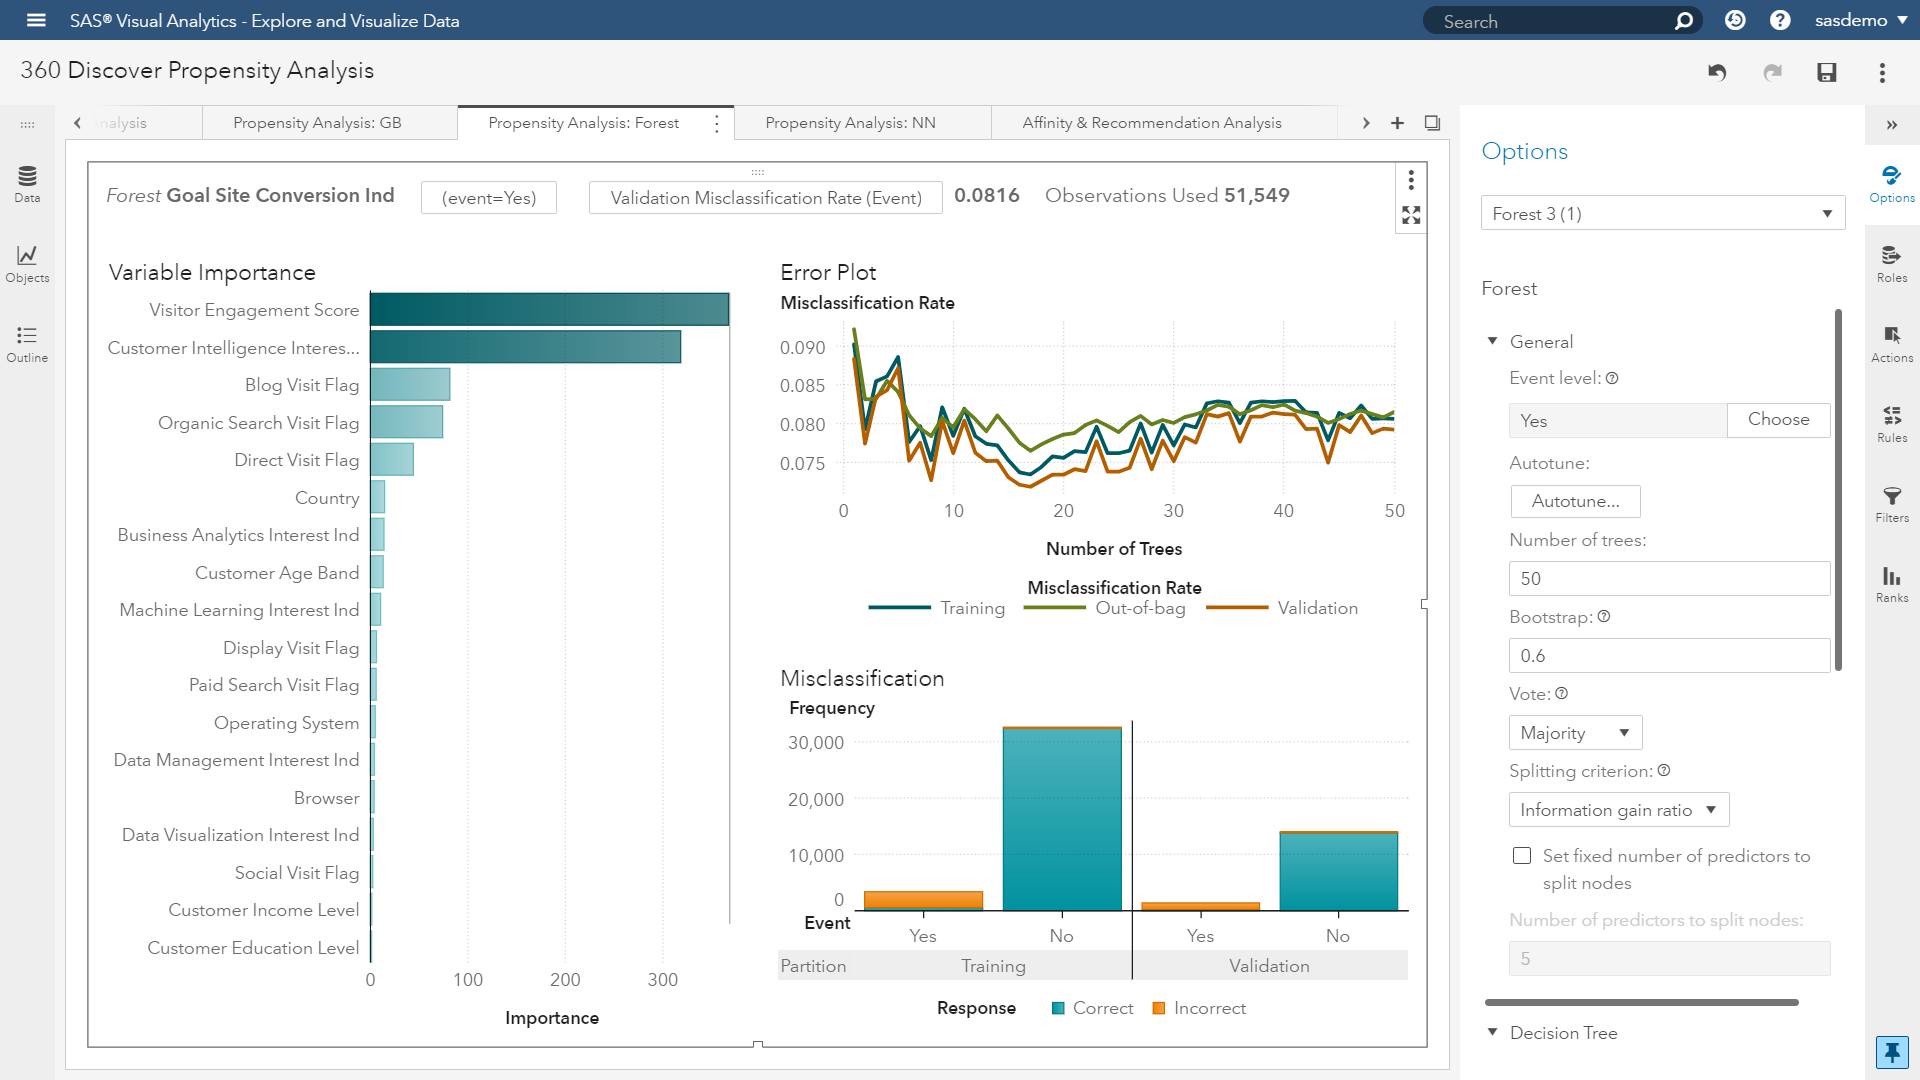
Here is an introductory video of building Forest models using SAS. The last model we will build is a neural network. Leveraging SAS PROC NNET, this approach is used to address a wide variety of tasks that are hard to solve using ordinary rule-based programming. The goal of the neural network is to solve problems in the same way that the human brain would. Beyond marketing uses, there is an immense amount of evidence for the value of neural networks in the area of artificial intelligence. Computer vision, speech recognition and driverless cars are common examples. Let’s use the same one-click option to duplicate a comparative model.
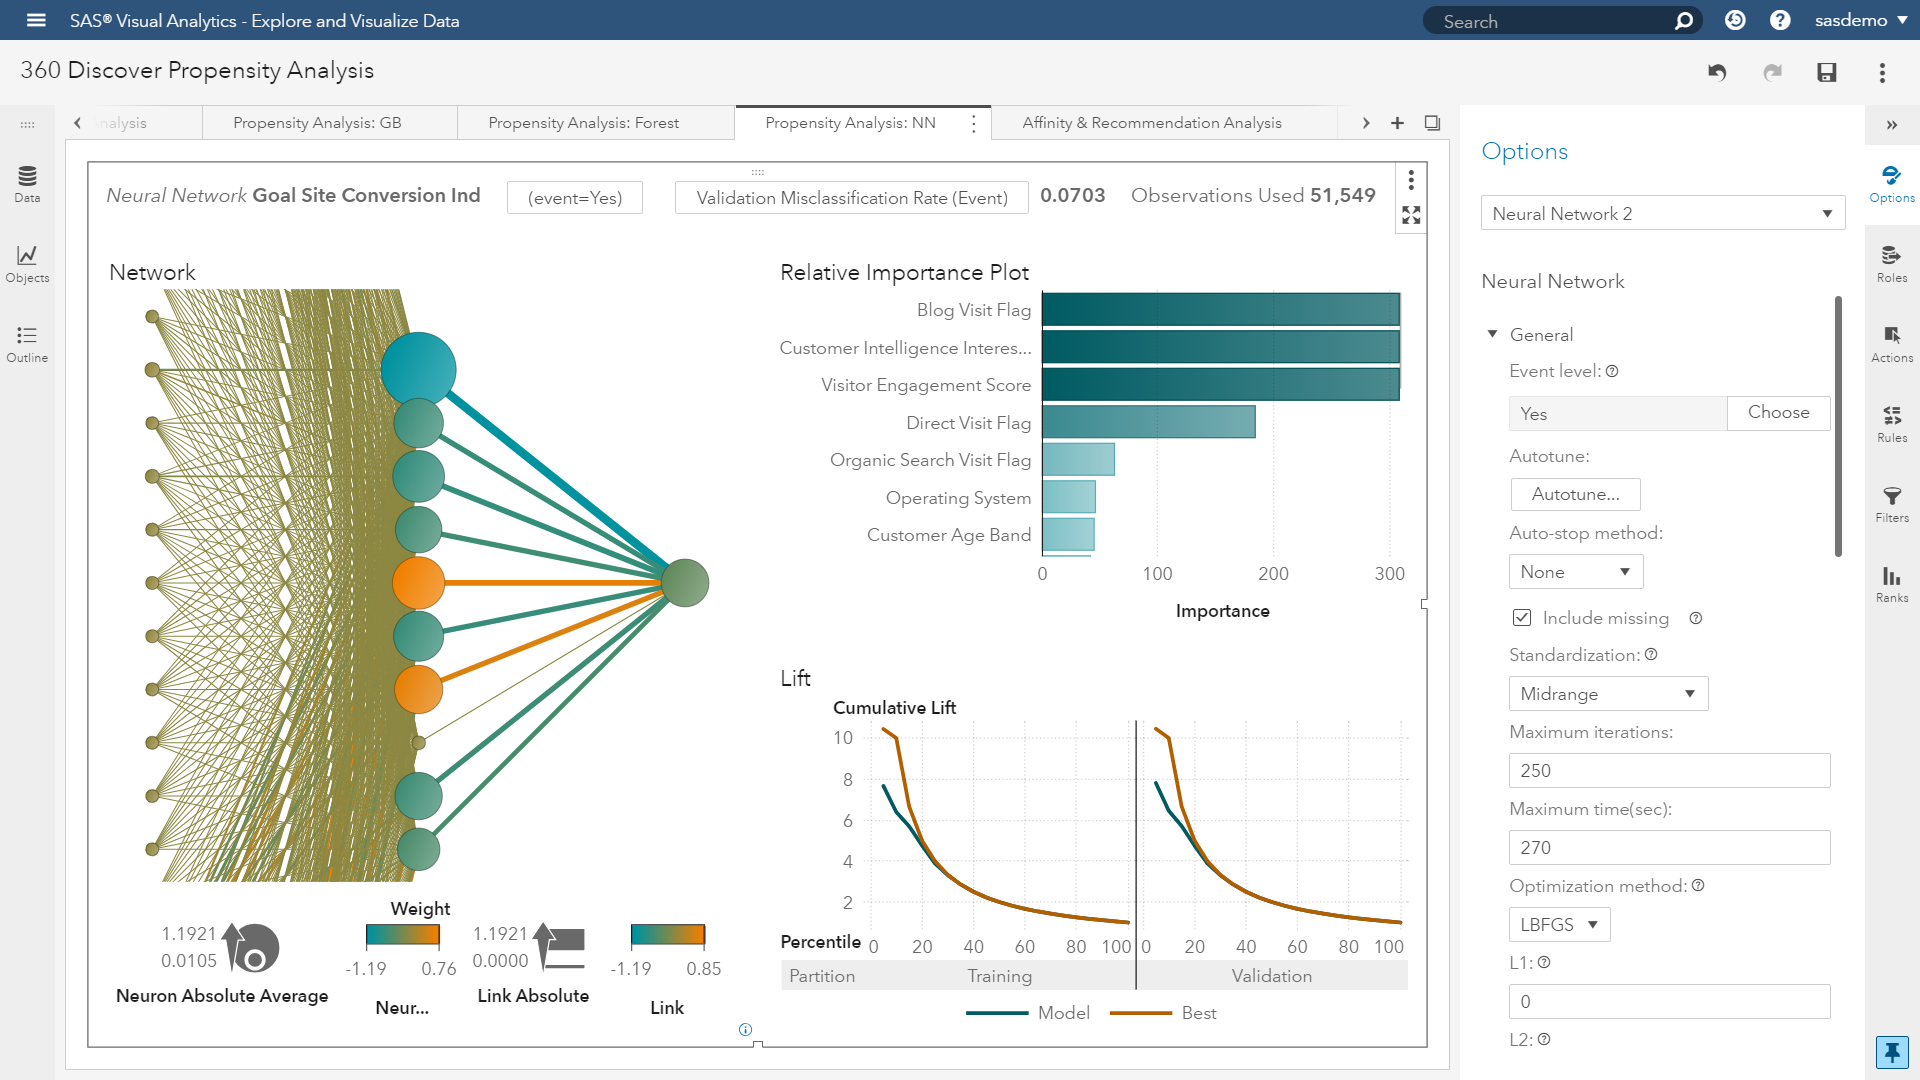
Here is an introductory video of building neural network models in SAS.
Stage three: Deployment
There are a few areas to consider here. Let’s begin by identifying which algorithm did the best job of understanding and predicting your macro or micro goal conversions. Our objective is to prioritize accuracy and minimize misclassification. We call this model comparison.
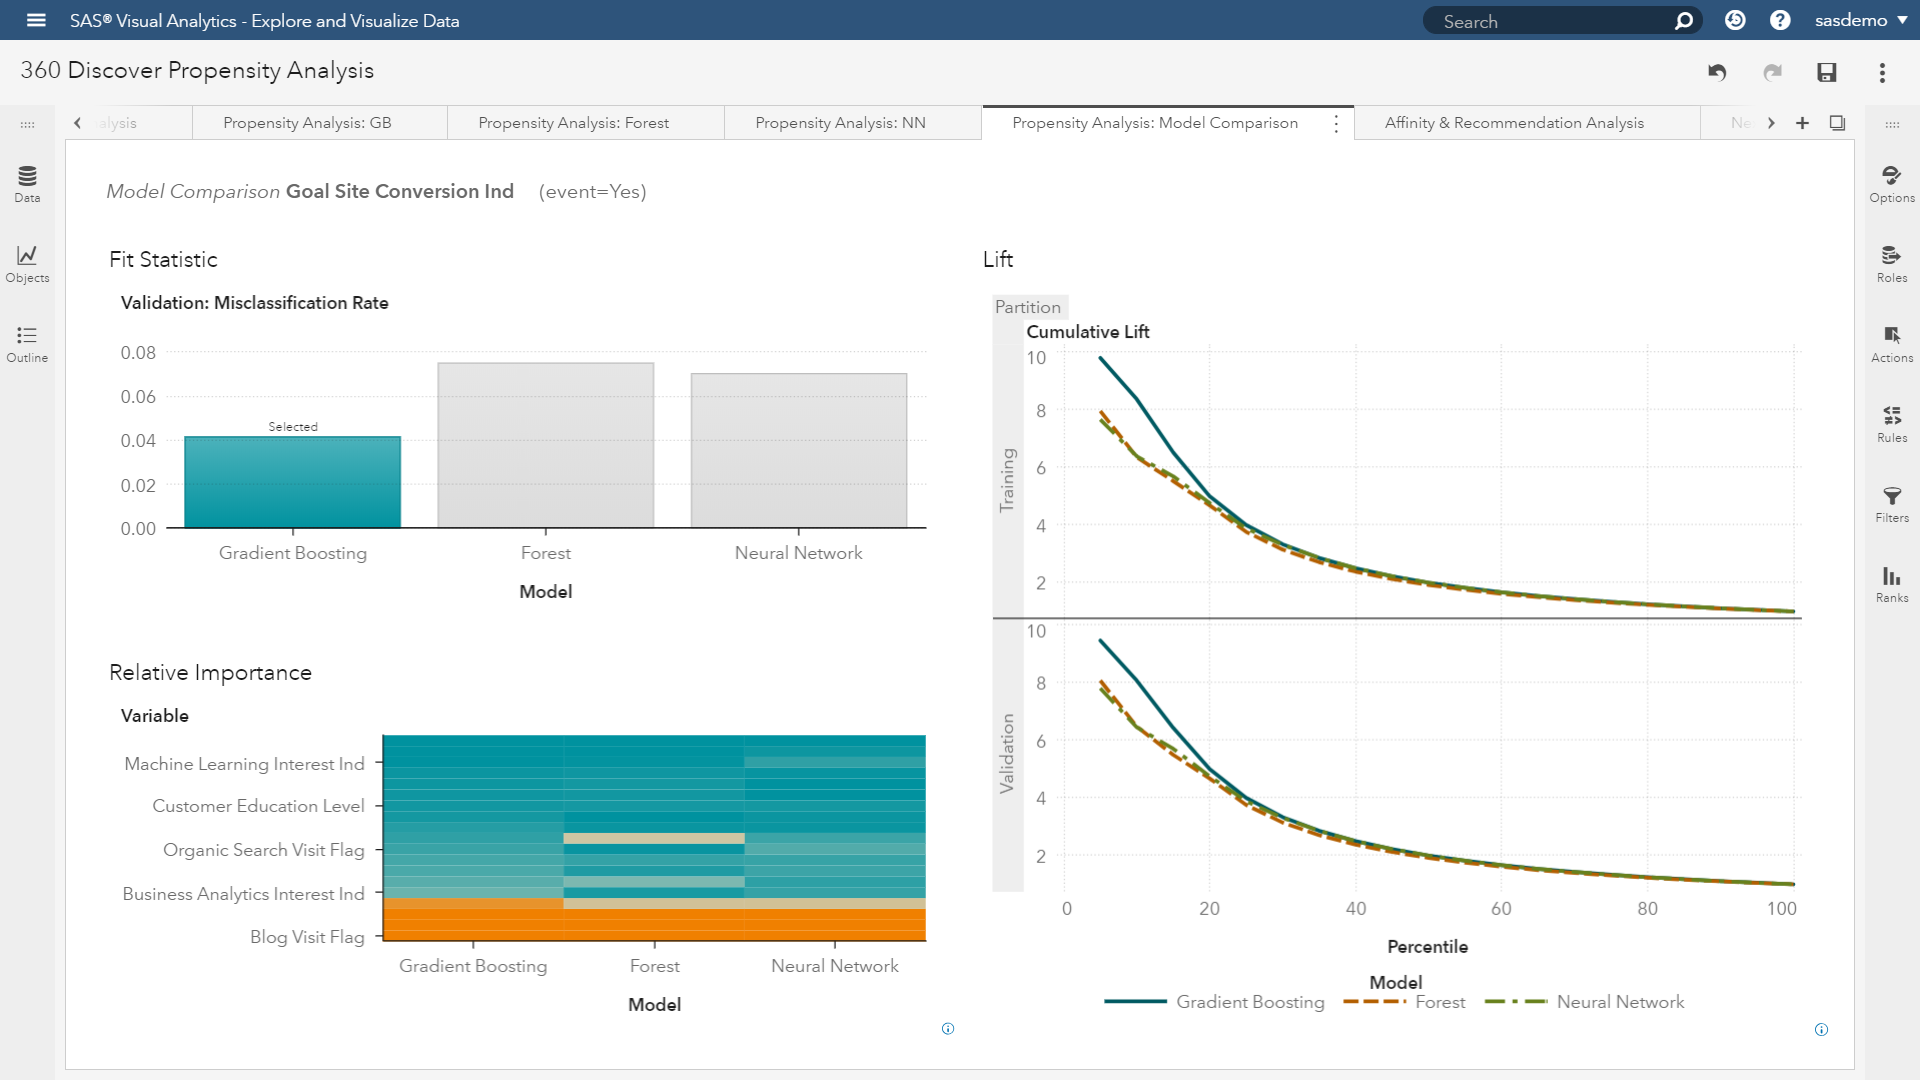
The model comparison dashboard indicates the gradient boosting algorithm is the winner. Focusing on the cumulative lift charts, it is evident that the top two deciles have higher lifts using this flavor of machine learning. Over the last few years, I have frequently heard clients debate about the practicality of machine learning because the output is difficult to interpret.
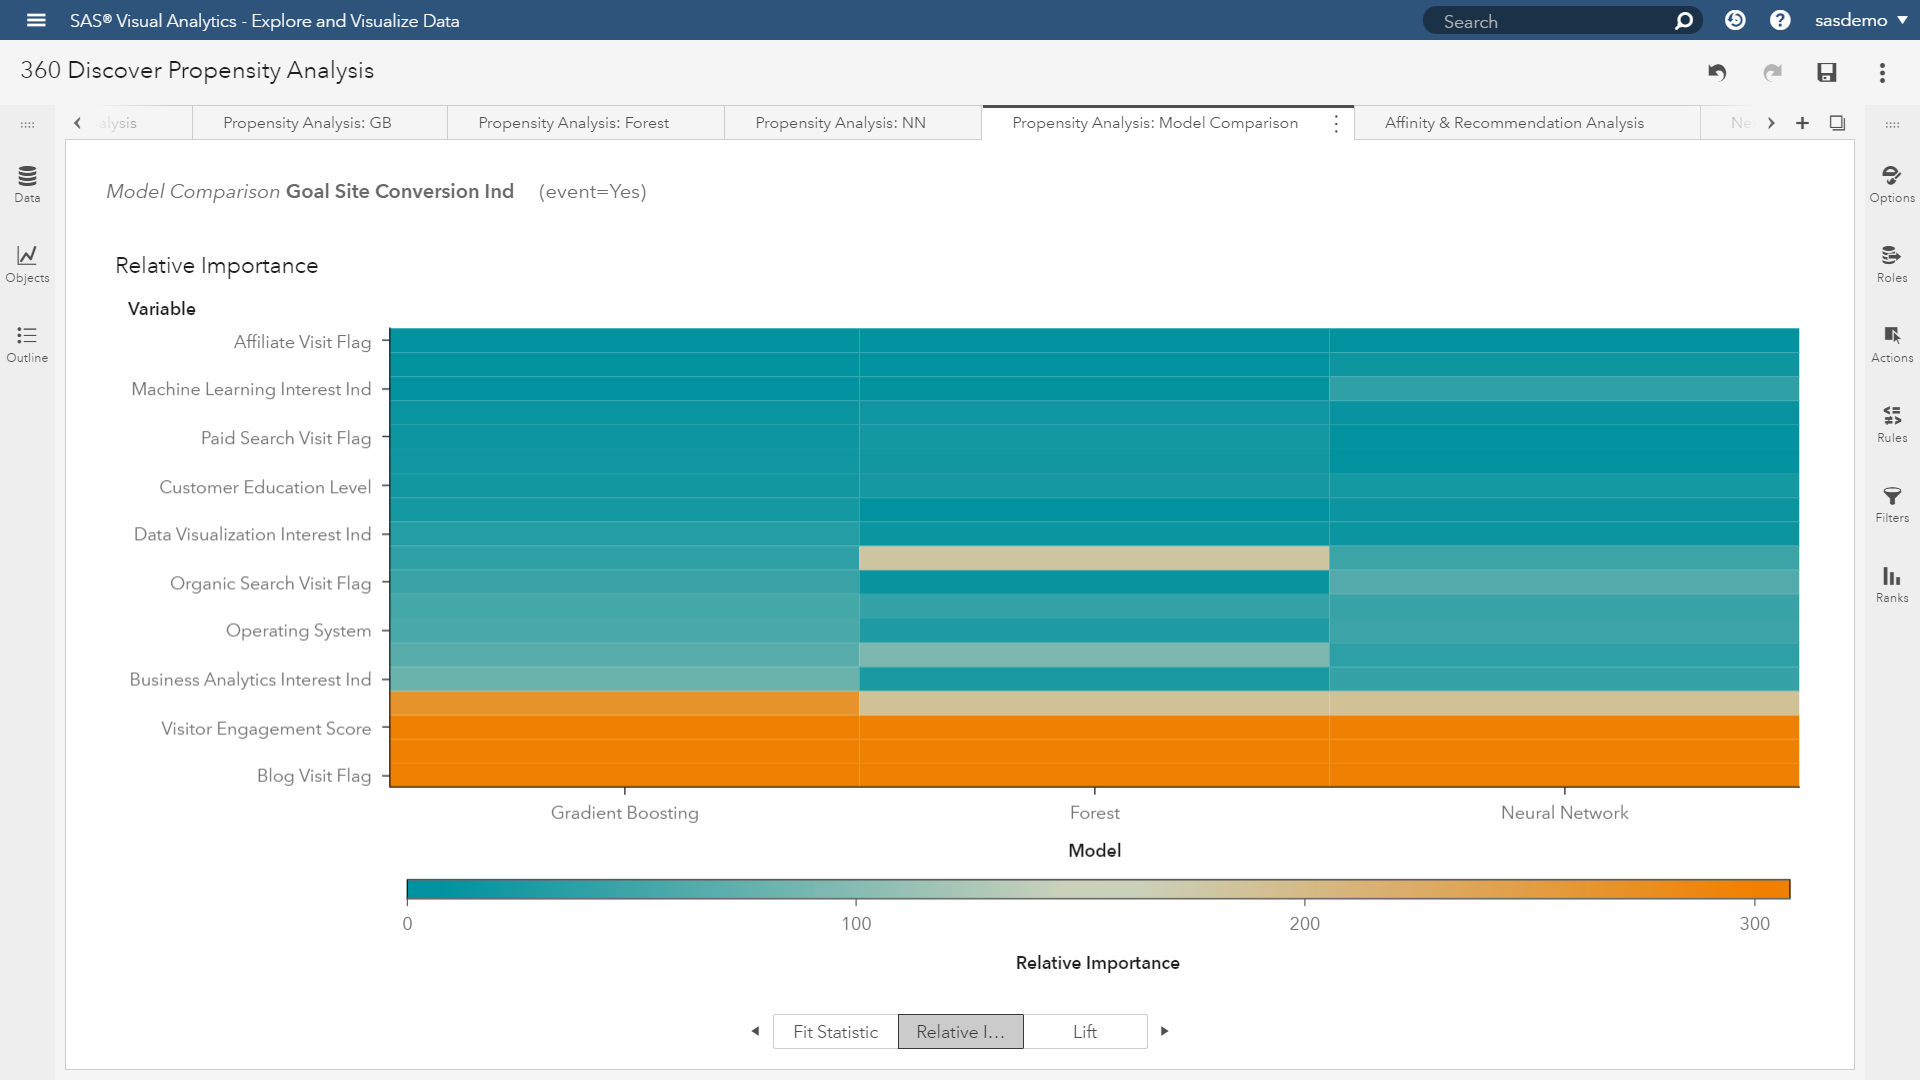
Leveraging a heat map visualization, users can ascertain which predictors contribute more (and less) relative importance to the propensity model. This provides transparency into understanding the model’s drivers. If you find this topic interesting, check out this great post on interpretability of machine learning.
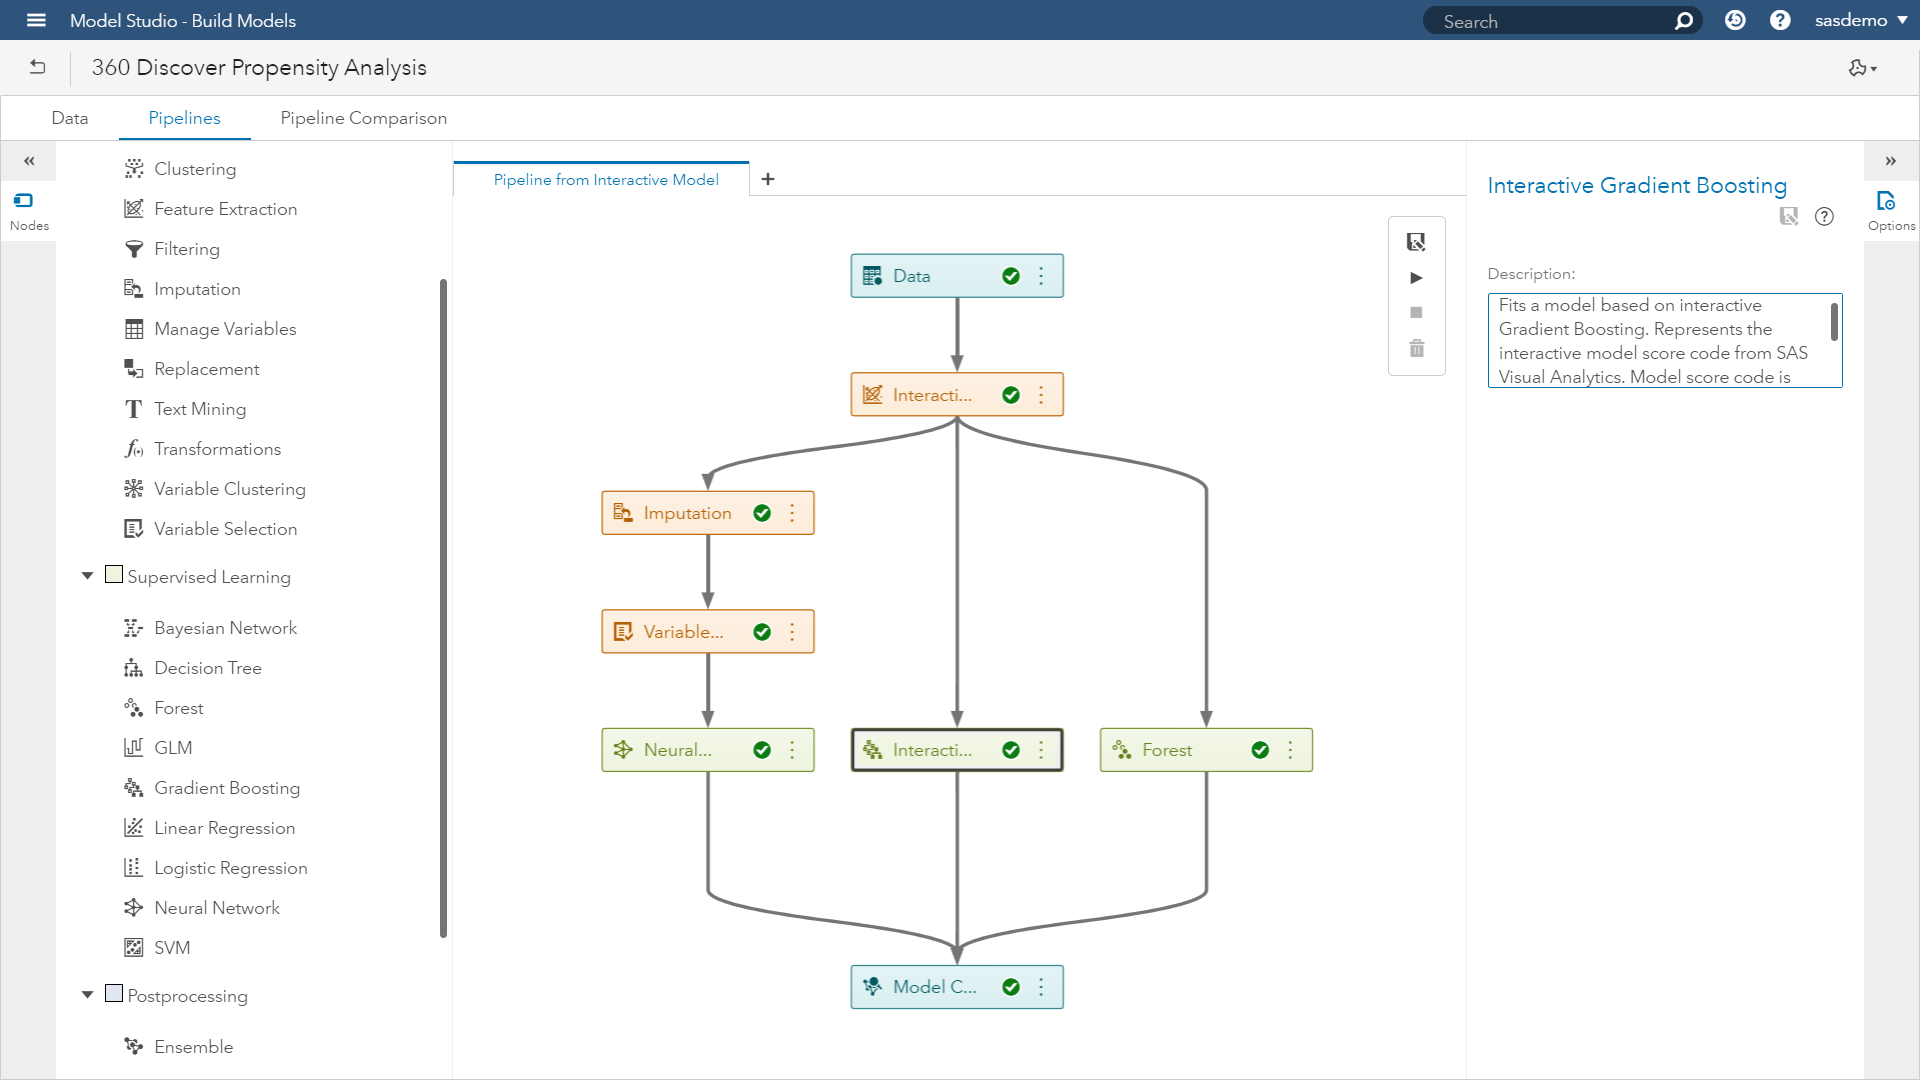
We are now prepared to take action with the intelligence of our champion model. The SAS platform will support packaging all of the steps taken from this interactive analysis into a pipeline modeling project. All of the metadata, transformations, and insights of the entire workflow are captured, and ready for deployment within SAS 360 Engage (or in a third-party marketing system) to support interaction management across consumer touchpoints.
What exactly does deployment mean? The outcome of a propensity model does one of two things:
- Propensity scoring (what is the website visitor’s probability percentage to convert?).
- Predicted outcomes (will the visitor convert - yes or no?).
When it comes to targeting audiences for web personalization, mobile cross-sell opportunities, or email win-back programs, this modeling output is crucial in including (or excluding) individuals for segmentation.
What options do analysts have in helping their marketing teams?
- Scoring identifiable and anonymous traffic.
- The ability to score in batch or real-time.
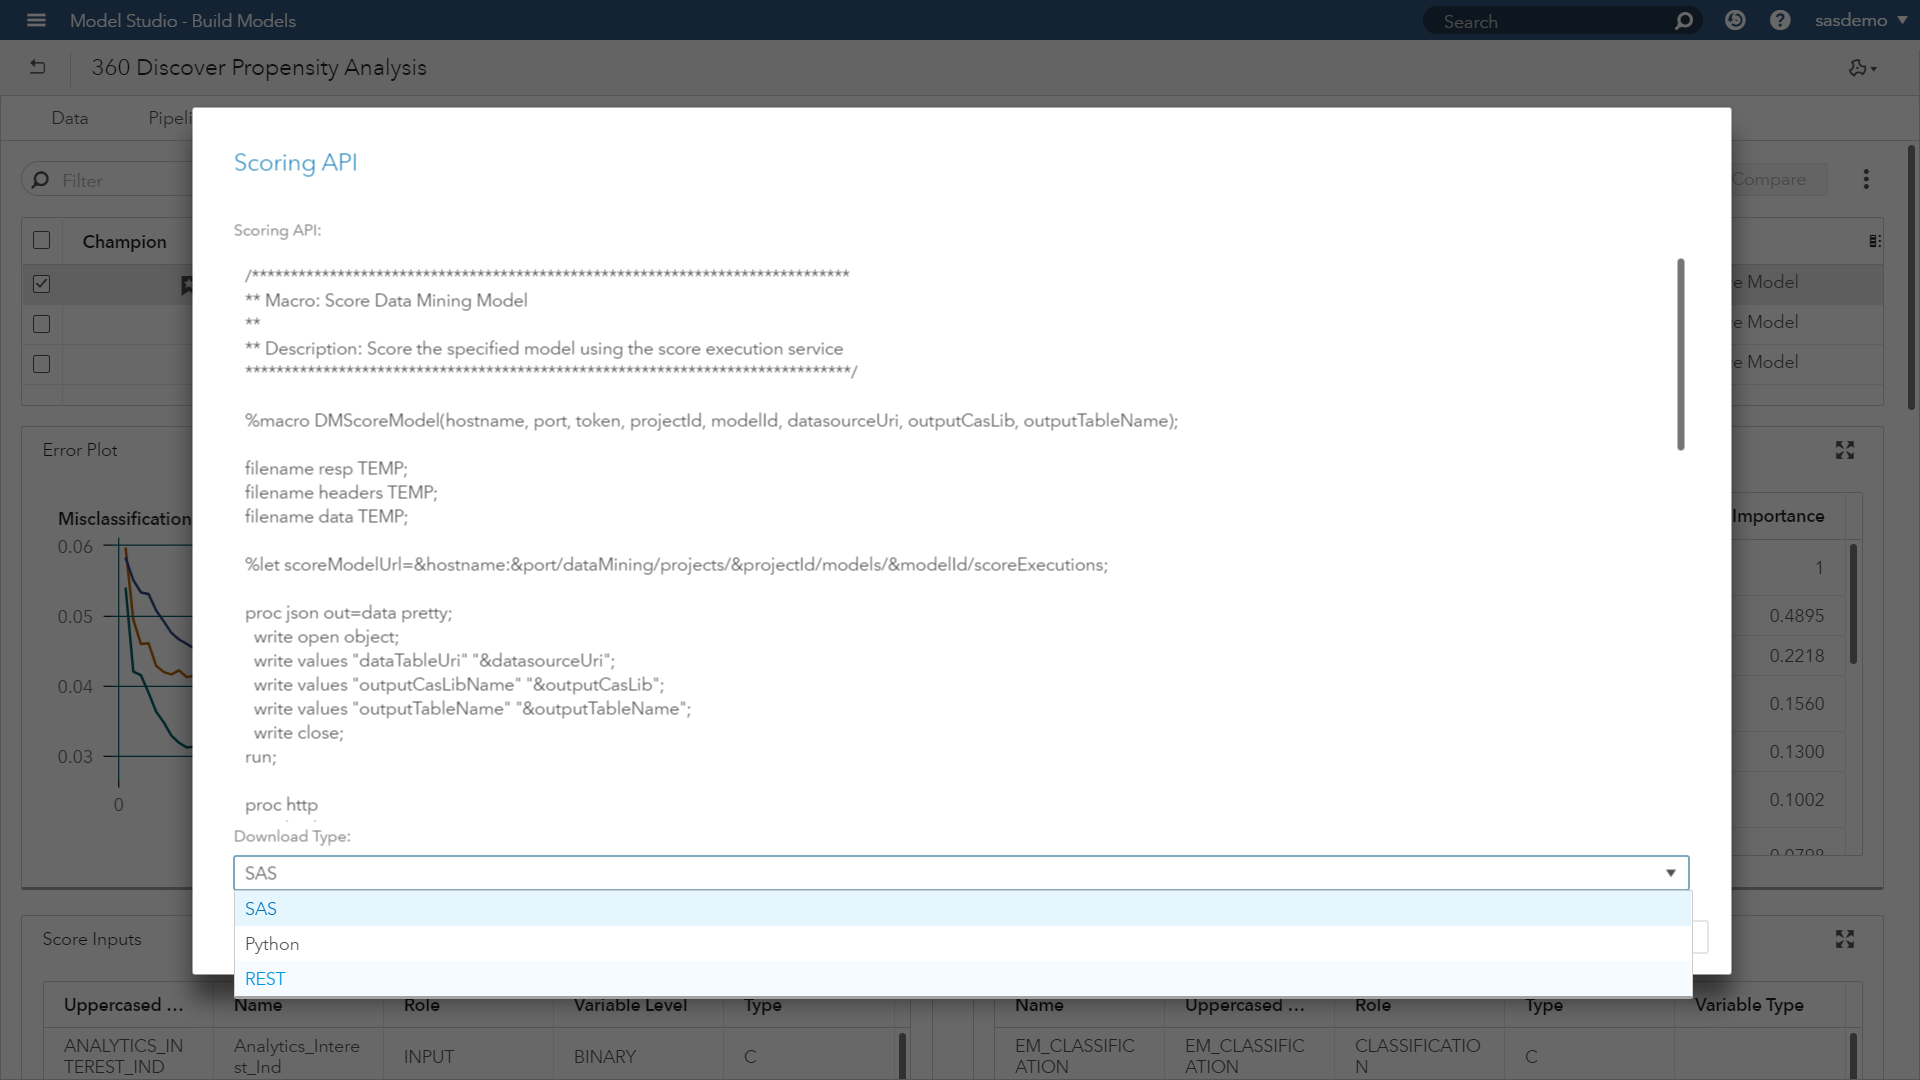
- Access to the model scoring engine (SAS, Python, or REST) for APIs through SAS analytic services.
Website use case: SAS.com
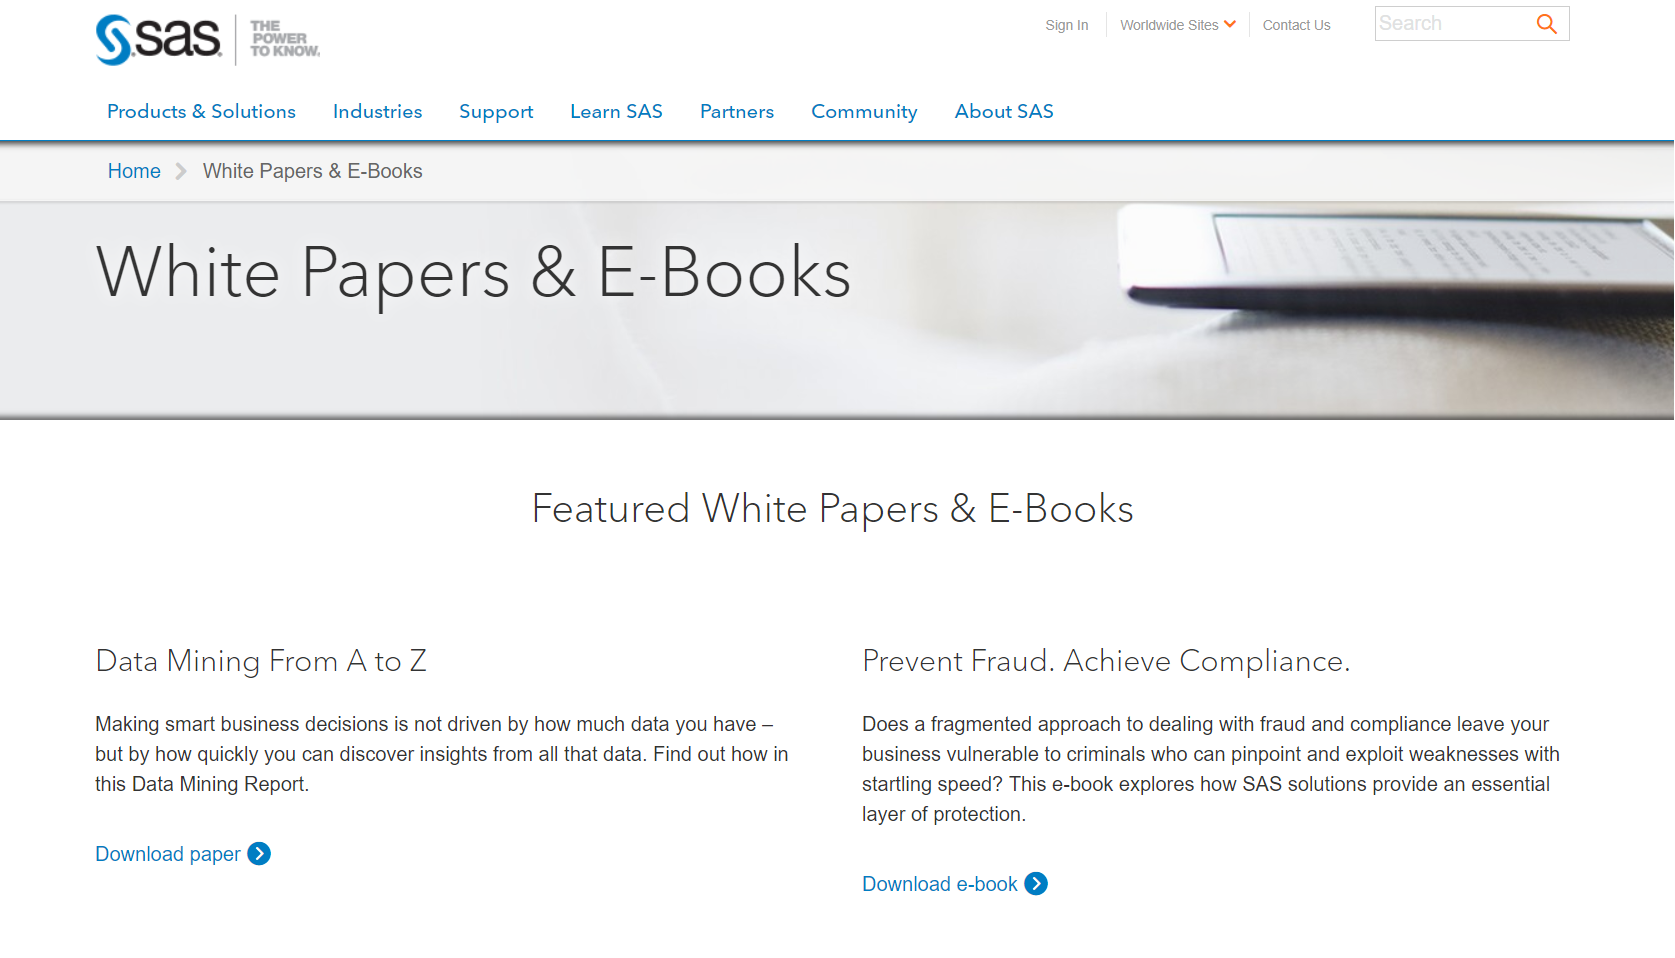
Let’s wrap this up with a simple example. Assume I have been interacting with a brand’s digital properties over the last few days across a number of visits. After receiving a mobile app offer to download a free whitepaper, I migrate to the website to obtain the content.
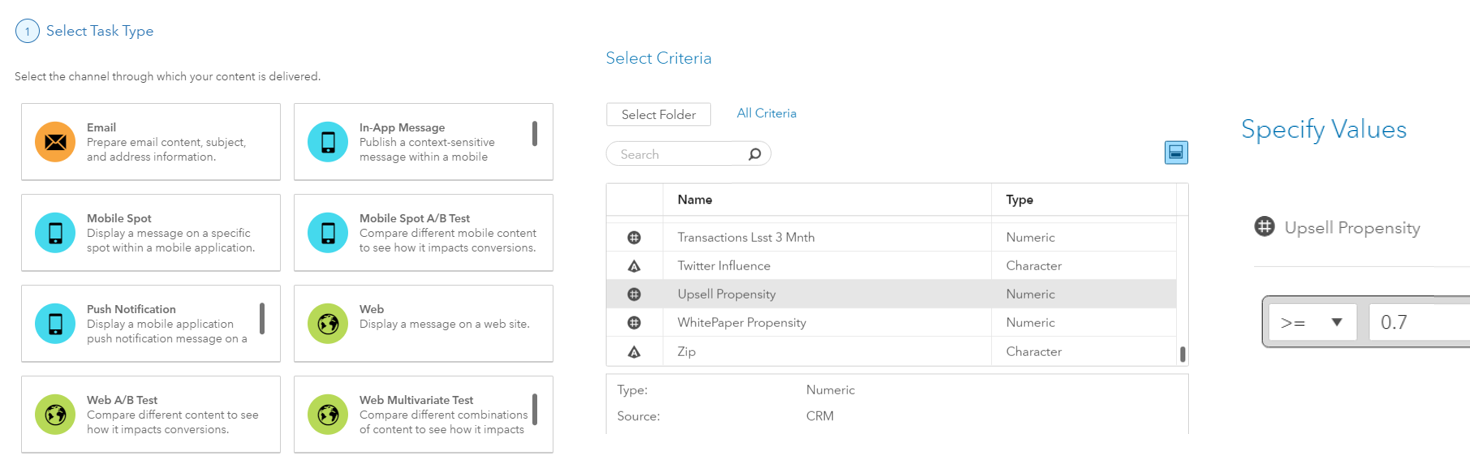
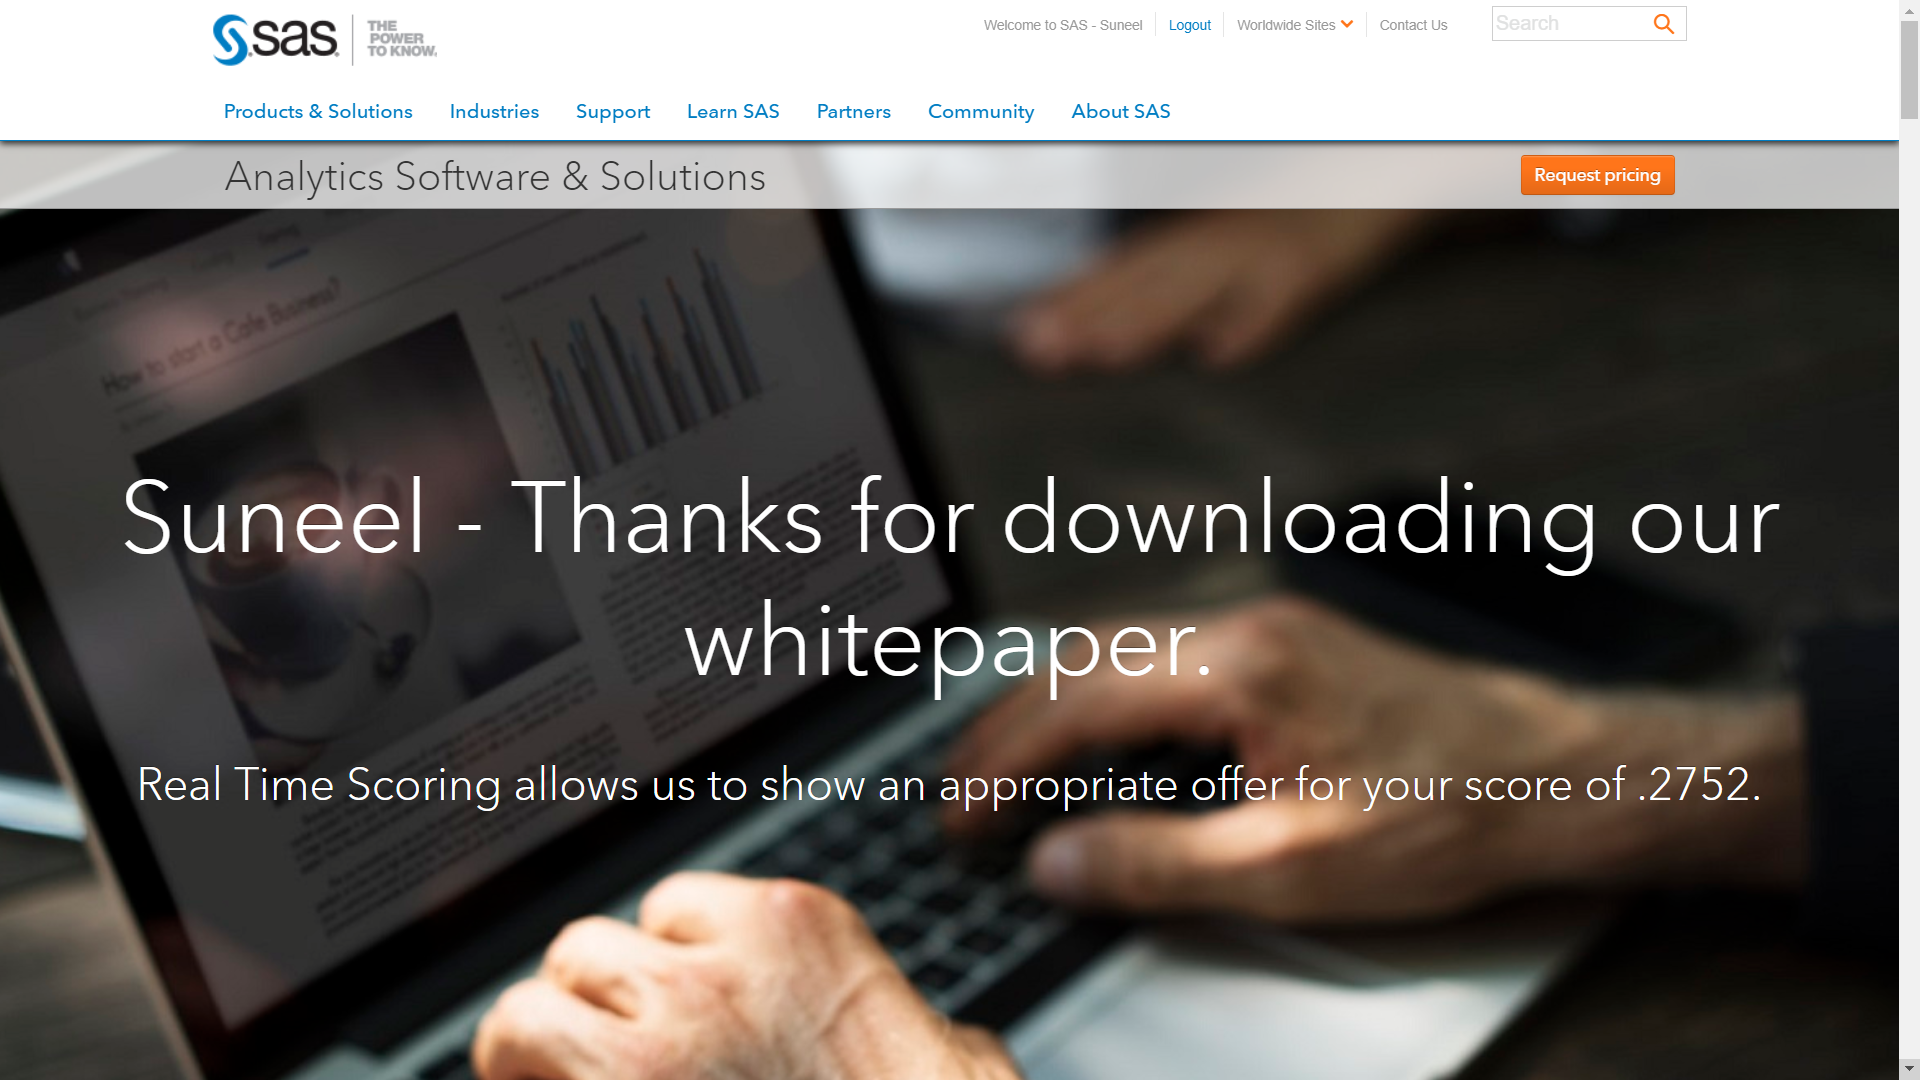
When I click the download paper button, this will generate an event in SAS 360 Engage to request the SAS platform to run a propensity model leveraging information related to my journey with the brand (it’s important to note this isn’t limited to just online behavior). A propensity score is returned, and the next page of my digital journey is one of two scenarios:
- If my score is high, I receive an analytically-driven cross sell offer.
- If my score is low, I receive a personalized message thanking me for the interaction.
Goals, propensity models, and machine learning coming together to fuel the digital experience. Websites, mobile apps, and other forms of digital properties exist for a reason. Let’s maximize their potential in this world of voluminous data and actionable analytics.

3 Comments
Great posting, love it! thanks Sunil :-)
Pingback: SAS Customer Intelligence 360: Automated AI and segmentation [Part 1] - Customer Intelligence Blog
Pingback: SAS Customer Intelligence 360: Hybrid marketing and analytic's last mile [Part 1] - Customer Intelligence Blog