Marketers and brands have used segmentation as a technique to deliver customer personalization for communications, content, products, and services since the introduction of customer relationship management (i.e., CRM) and database marketing. Within the context of segmentation, there are a variety of applications, ranging from consumer demographics, psychographics, geography, digital behavioral events, and more. Over time, segmentation has proven its value, and brands continue to use this strategy across every stage of the customer journey:
- Acquisition
- Upsell/cross-sell
- Retention
- Winback
With that said, here are three goals that most organizations share as they measure the performance of their segmentation strategies:
- Did we sell more?
- Is our marketing more effective?
- Are we delighting customers?
Let’s walk through one of the goals cited above.
What does sell more actually mean?
- Do x (more cross-sell or upsell efforts).
- Improve y (increase conversion rates).
- Reduce z (reduce abandon cart rates).
Segmentation plays a role within any brand’s efforts to improve these critical metrics. As analysts, we're frequently asked why a key metric is higher or lower than expected. Dashboards, reports, and visualizations can show audiences what happened, what's higher or lower than expected, but rarely answer the central question of why.
We can do better.
Every marketing analytic problem requires three key considerations.
- What data can we leverage?
- Is there an analytic method that can help us discover insight?
- How will we deploy on insight to take action?
Consideration 1: What data can we leverage?
Whenever I meet with clients, one of the first questions I pose in a meeting is:
Are you exploiting your 1st party data to its fullest potential?
Your brand’s first-party data belongs to you and only you. It can provide differentiating insights about attractive customer (and prospective) segments that none of your competitors have access to. That translates to data assets that are ripe for analytical exploitation. But how you capture this information can have a tremendous impact on it’s potential.
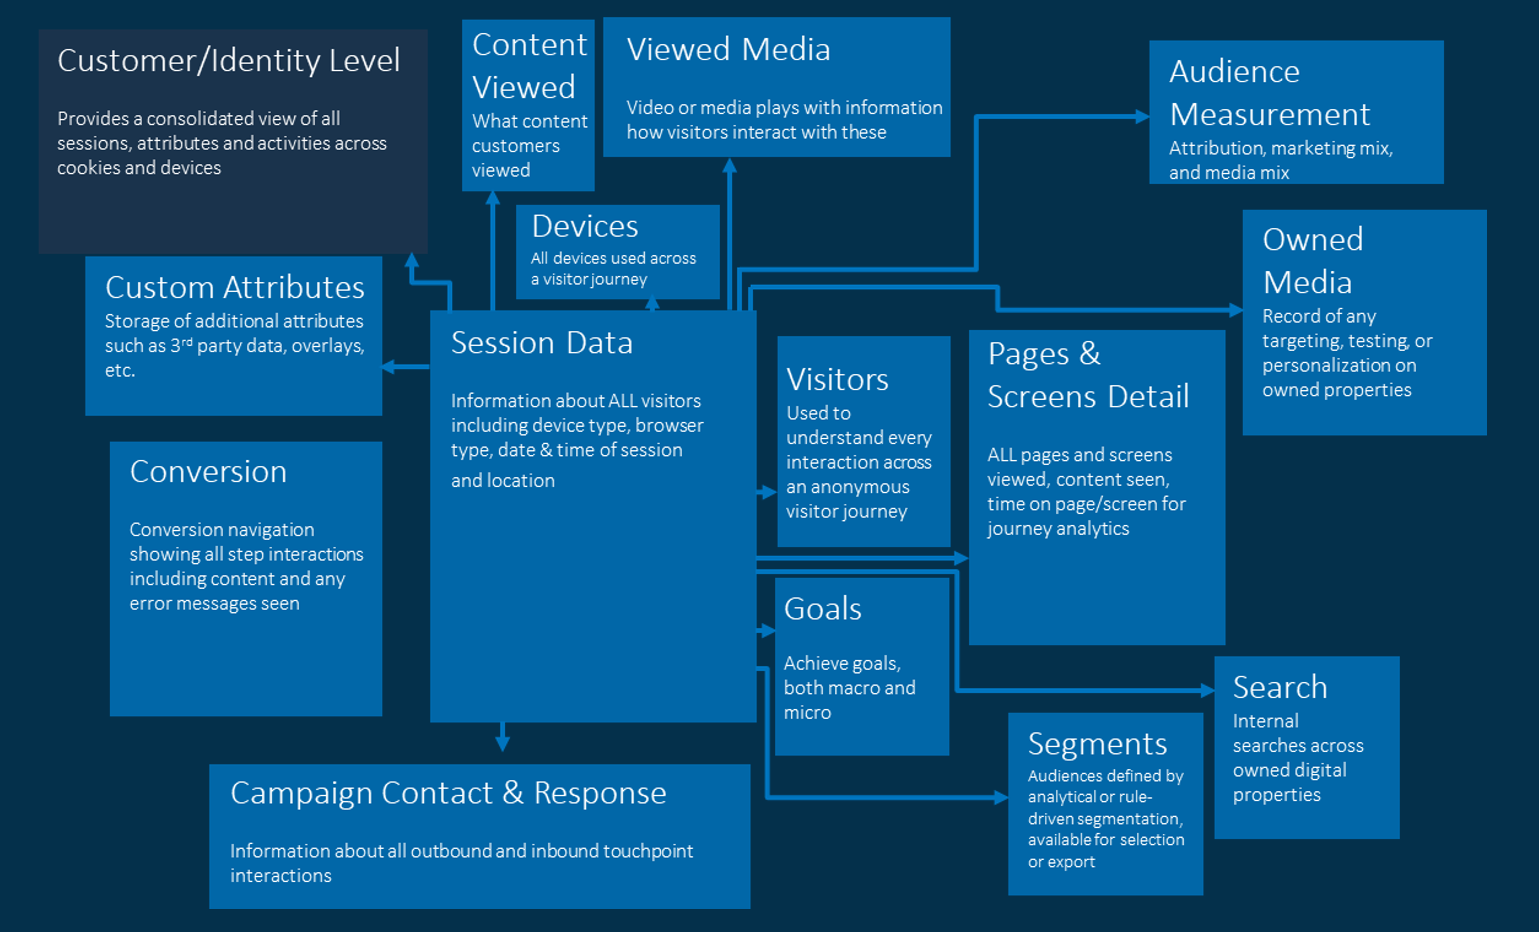
Leveraging data collection mechanisms, SAS Customer Intelligence 360 captures first-party behavioral information across your brand’s digital customer experience. As visitor journeys flow across touch points, SAS integrates these data streams into structured views. Once normalized, the output provides a variety of aggregated tables of digital interactions, including views that accelerate a user to stitch online and offline data together deterministically, as well as perform algorithmic segmentation.
I don’t know about your experiences as an analyst, but mine never involved a senior leader opening a meeting with, “I can’t wait to hear how data prep is going …”
They care about how your derived insights will alter strategies to improve performance metrics. Nothing else.
Take a step back from segmentation, and imagine the possibilities - users can select structured digital data to build analyses for:
- Identifiable traffic and next-best-action targeting.
- Anonymous traffic and macro/micro goal propensity targeting.
- Enabling recommendation systems.
There are other use cases, but my intent is to get your mind generating ideas. Now that first-party digital data is within grasp, analysts can join this information with offline information sources, treat quality issues, transpose columns into zero-one predictors, perform analytical partitioning, and engineer features.
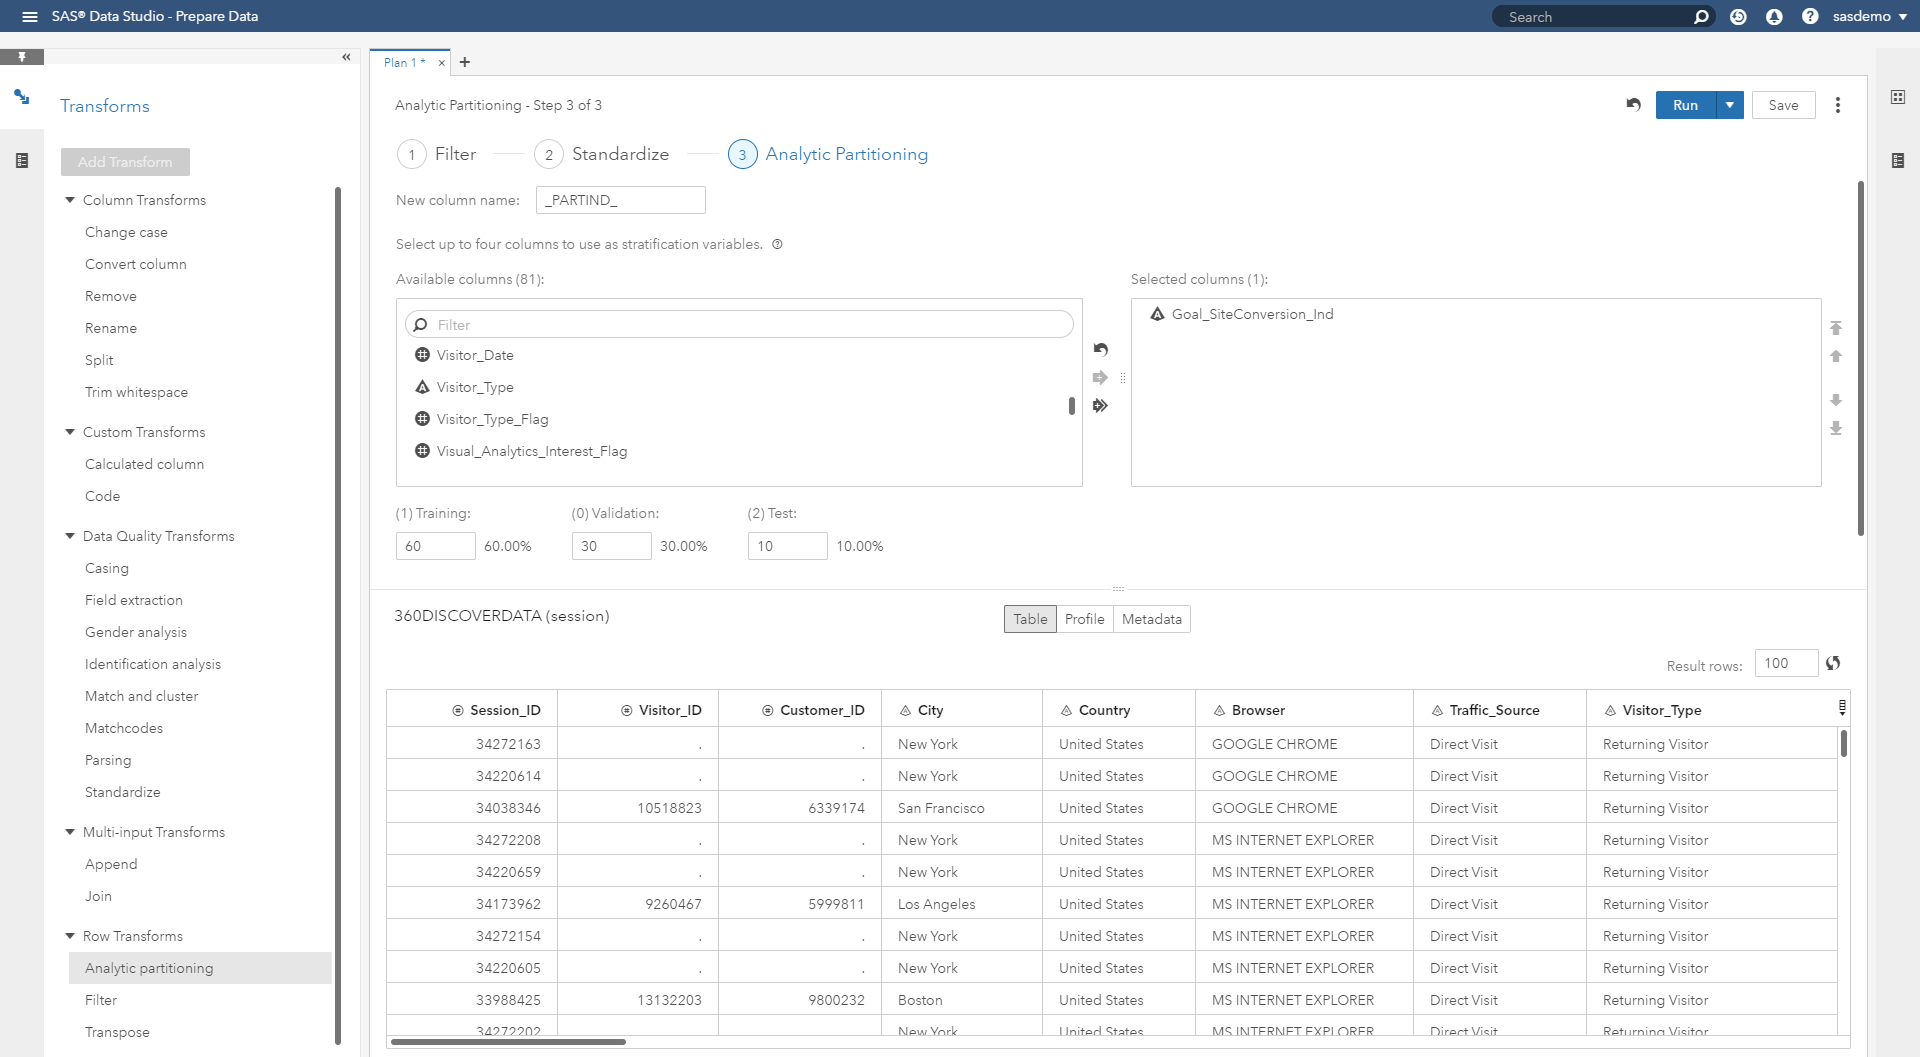
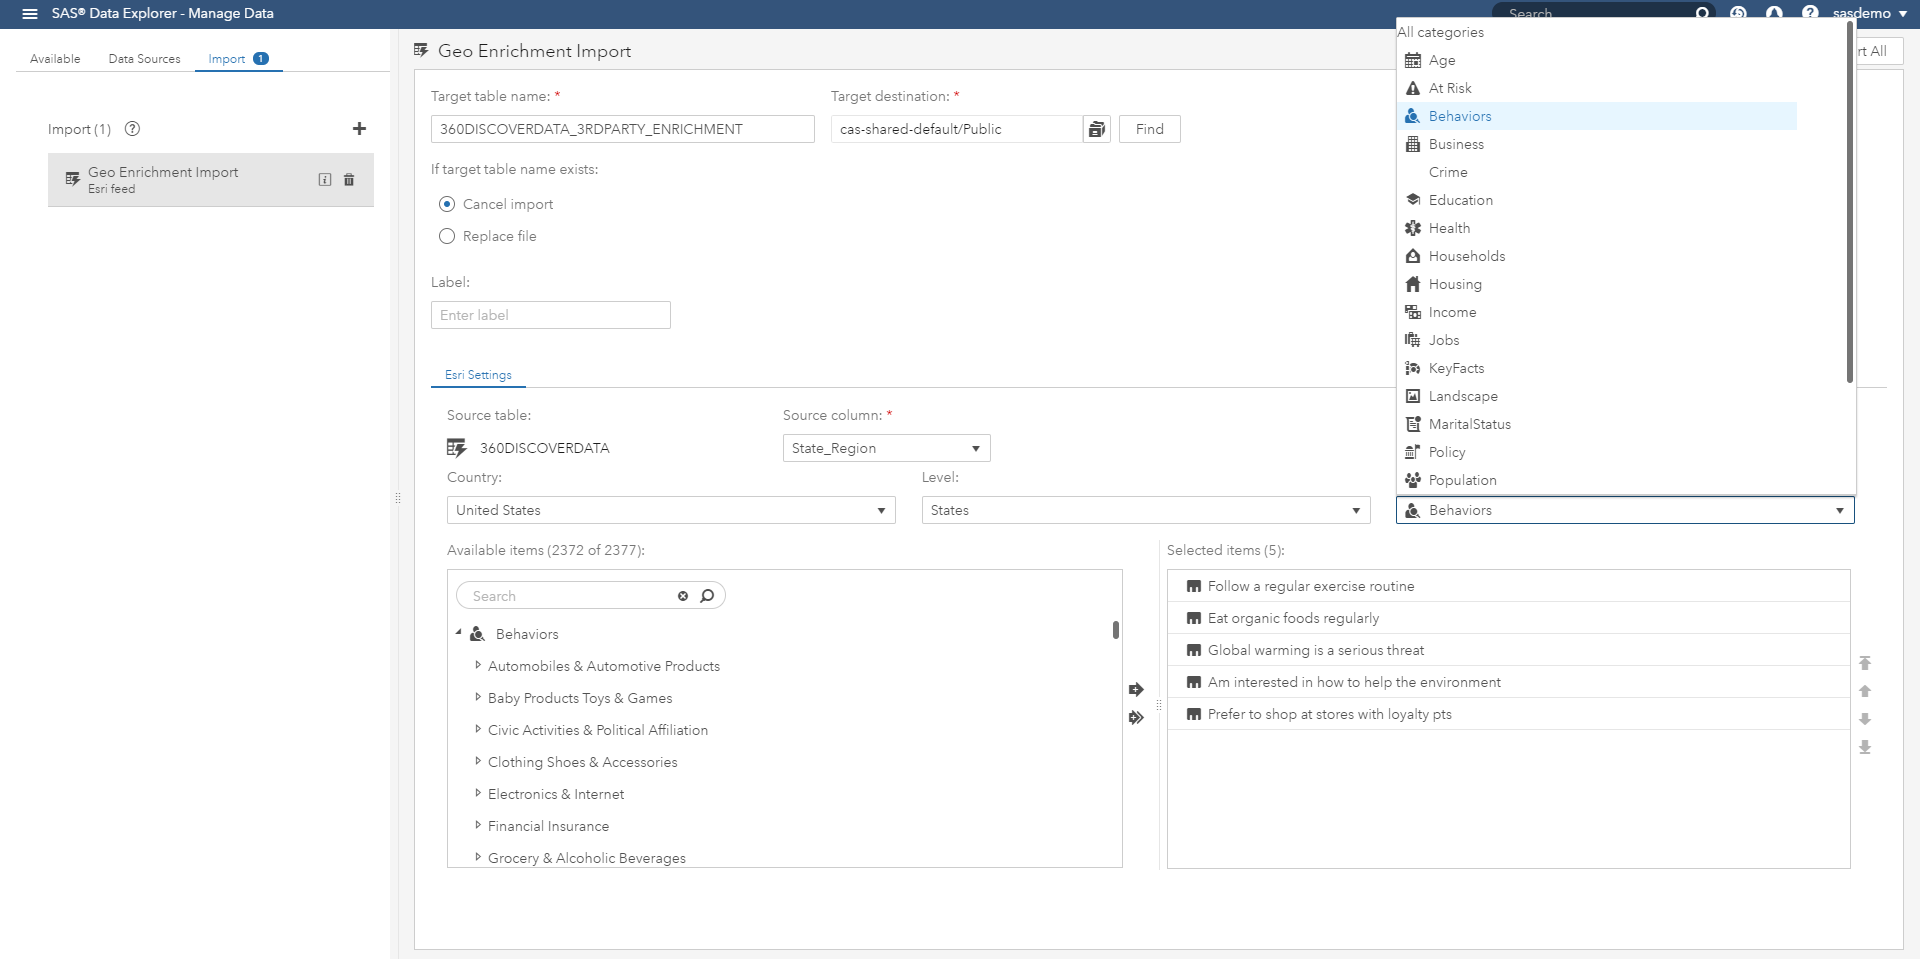
Prefer point and click? We've got your back. Love to code? We didn’t forget about you either. Desire to decorate your digital journey data with third-party attributes? No problem. Here's an example of accessing information sourced from ESRI, although any external data provider applies.
Data preparation is an art, and enabling users at this stage of the segmentation process results in the differentiation of average vs. game-changing efforts.
Consideration 2: Is there an analytic method that can help us discover insight?
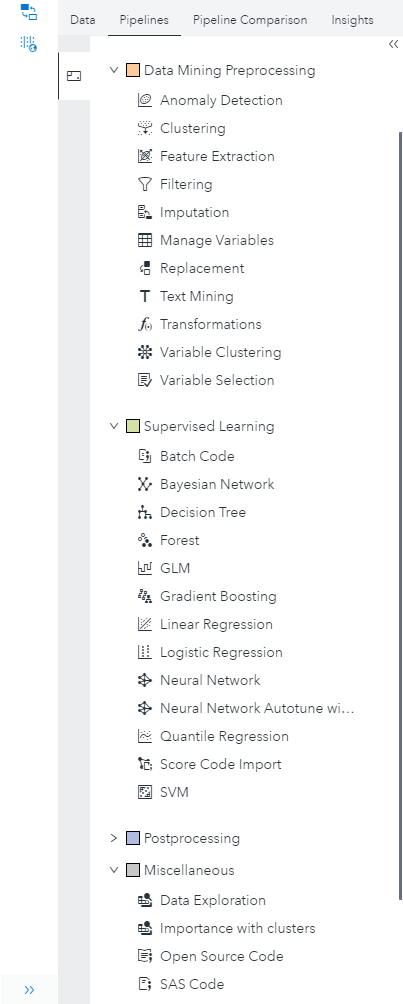
Once data is ready, analysts can perform exploratory visualization and artisanal modeling. Given that customer behavior varies over time when thinking about segmentation, there isn’t one algorithm that rules them all. Users are offered a variety of techniques to select for both supervised and unsupervised approaches.
One of the wonderful aspects about my client-facing role at SAS is the breadth of audiences that I get an opportunity to work with. No matter where you fall on this list:
- Data engineer
- Business analyst
- Citizen data scientist
- Data scientist
- Statistician
- Executive
One topic is certain. We all love data. It’s beautiful, surprising, inspiring, emotive, compelling and persuasive. Data is power. But we only feel these emotions when we arrive at the infamous “ah-ha” moment of analysis that makes us leap out of our seats!
However, I never hear clients express how much free time they have. The feedback is typically centered on not having enough resources or talent to meet objectives. What if we could accelerate to “ah-ha” moments without sacrificing quality?
SAS has been investing in research and development efforts around analytical automation designed to support the needs of a business analyst and citizen data scientist, as well as a statistician or data scientist. The question I’d like to address is:
What makes analytical automation useful in assisting people who are making or influencing changes to improve performance outcomes?
At the end of the day, anyone working with data has the potential to persuade decision makers. According to Rick Styll’s proceeding paper from SAS Global Forum 2019, there is a confluence of trends that is driving the demand, feasibility, and availability of automated analysis.
- Growing sizes of data (sensors, websites, apps, social, external, etc.).
- The awareness of the value that predictive analytics and machine learning enables has soared.
- Data scientists and available time are in limited supply.
- High-performance computing now enables interactive modeling on very large volumes of data.
- Cloud infrastructure and technology has reduced costs and deployment times dramatically.
- Natural language processing is making conversational analytics a reality.
Let’s walk through an analysis together that combines automated machine learning and natural language explanations of the segmentation results. The objective will be to derive actionable audiences who have higher propensities to meet our brand’s conversion goal (i.e. revenue-driving event). The benefit of this effort will provide guidance on who qualifies for marketing tactics like retargeting, personalization, and testing. In other words, which segments are worth targeting with our limited resources, and which aren’t.
The first step is to select the attribute in our data that represents the conversion event of interest, right-click, and select explain.
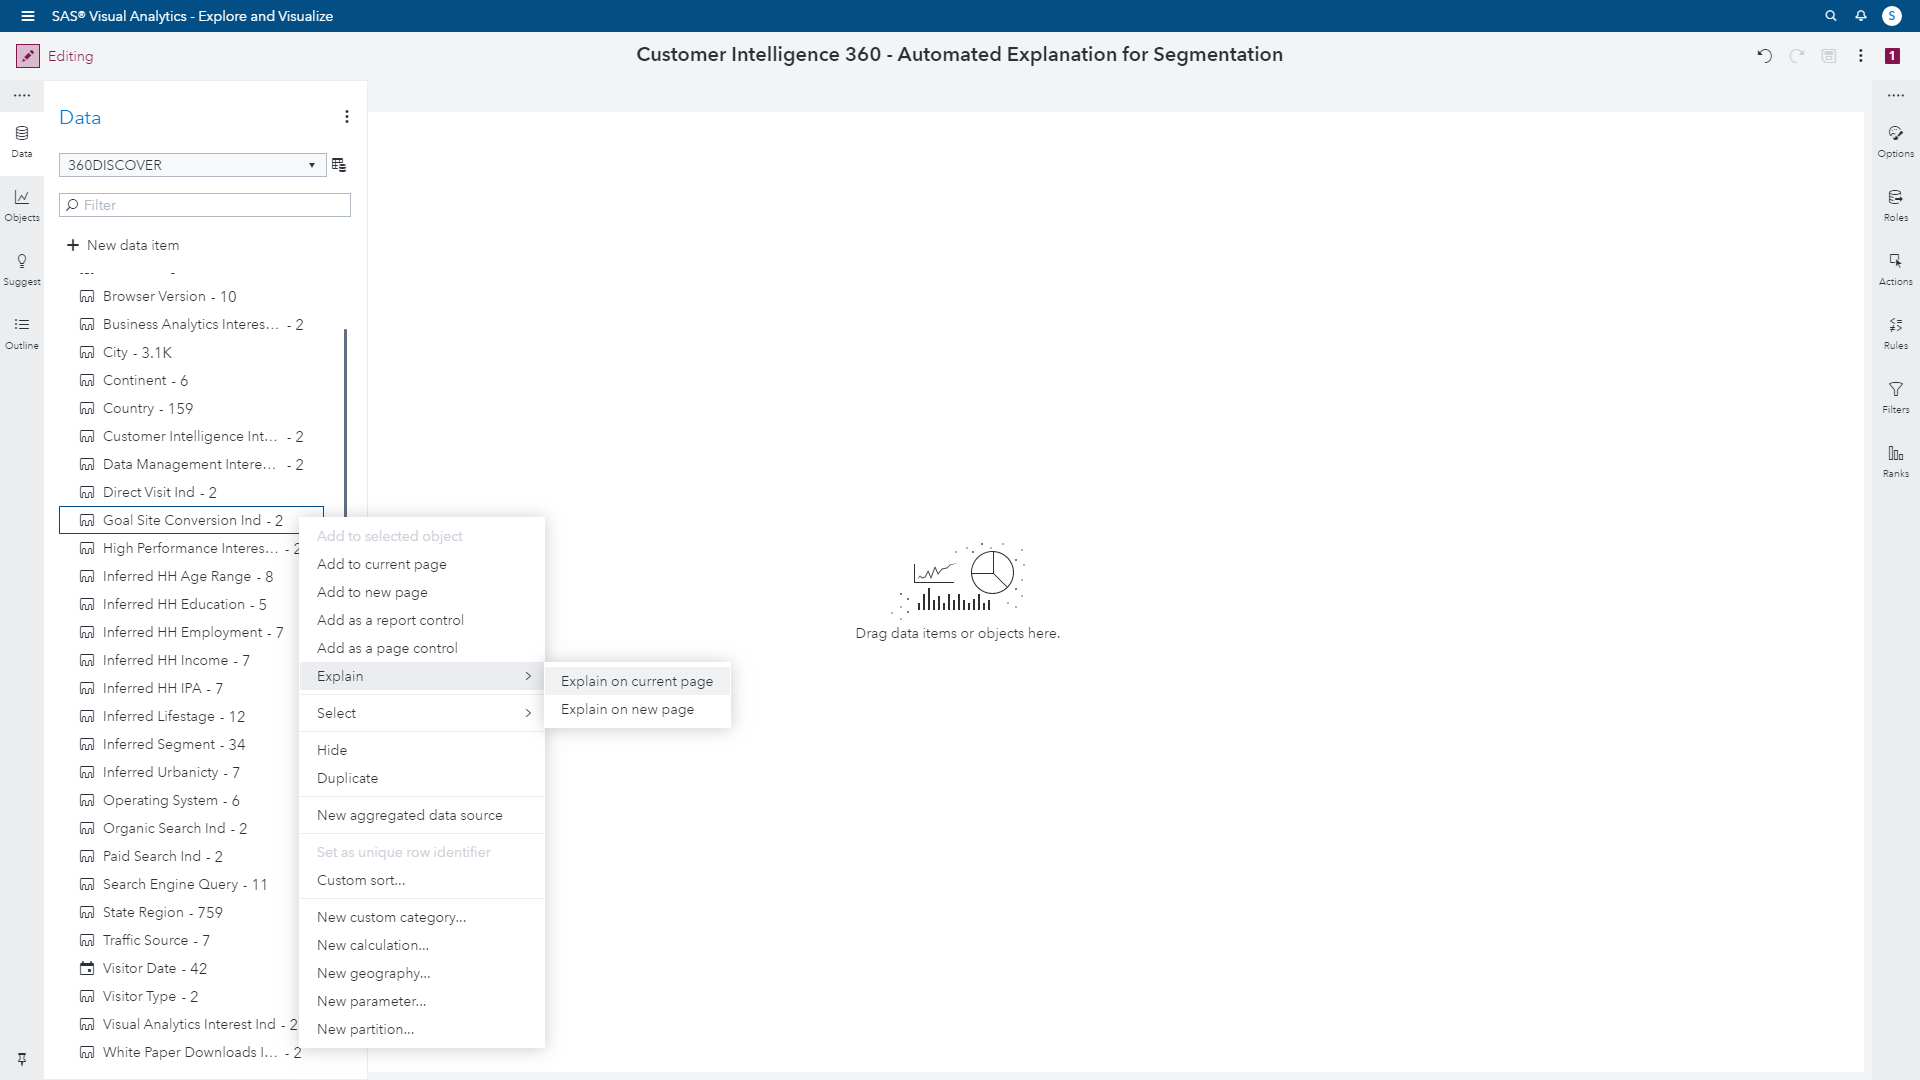
Automated explanation quickly determines the most important underlying factors (or predictors) for the conversion outcome by analyzing all of the rows and columns of the input data.
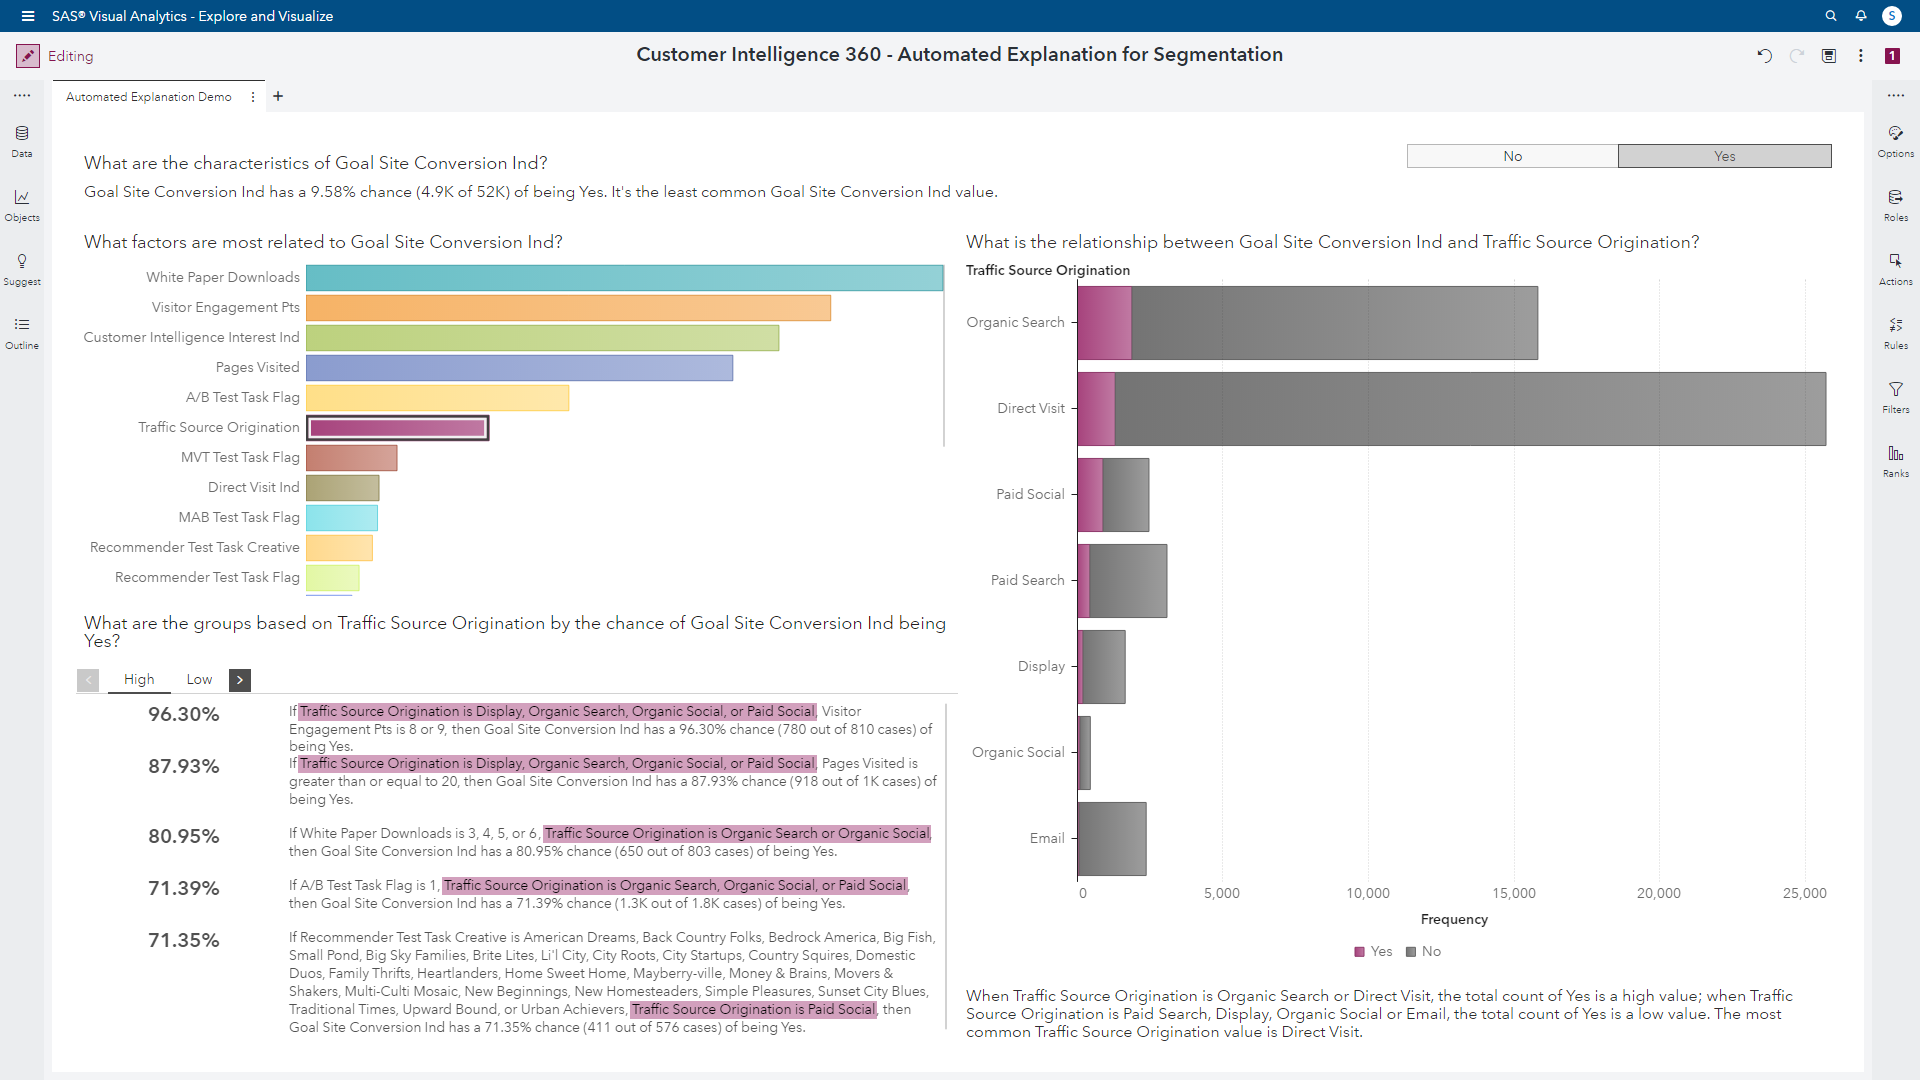
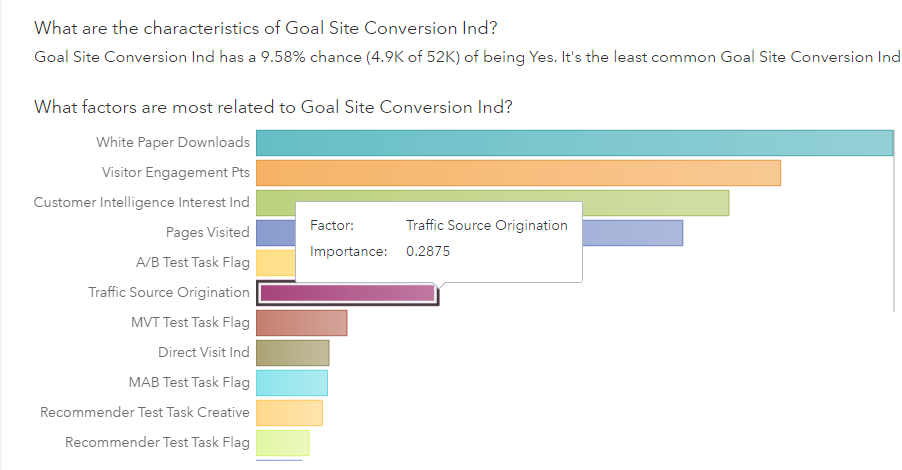
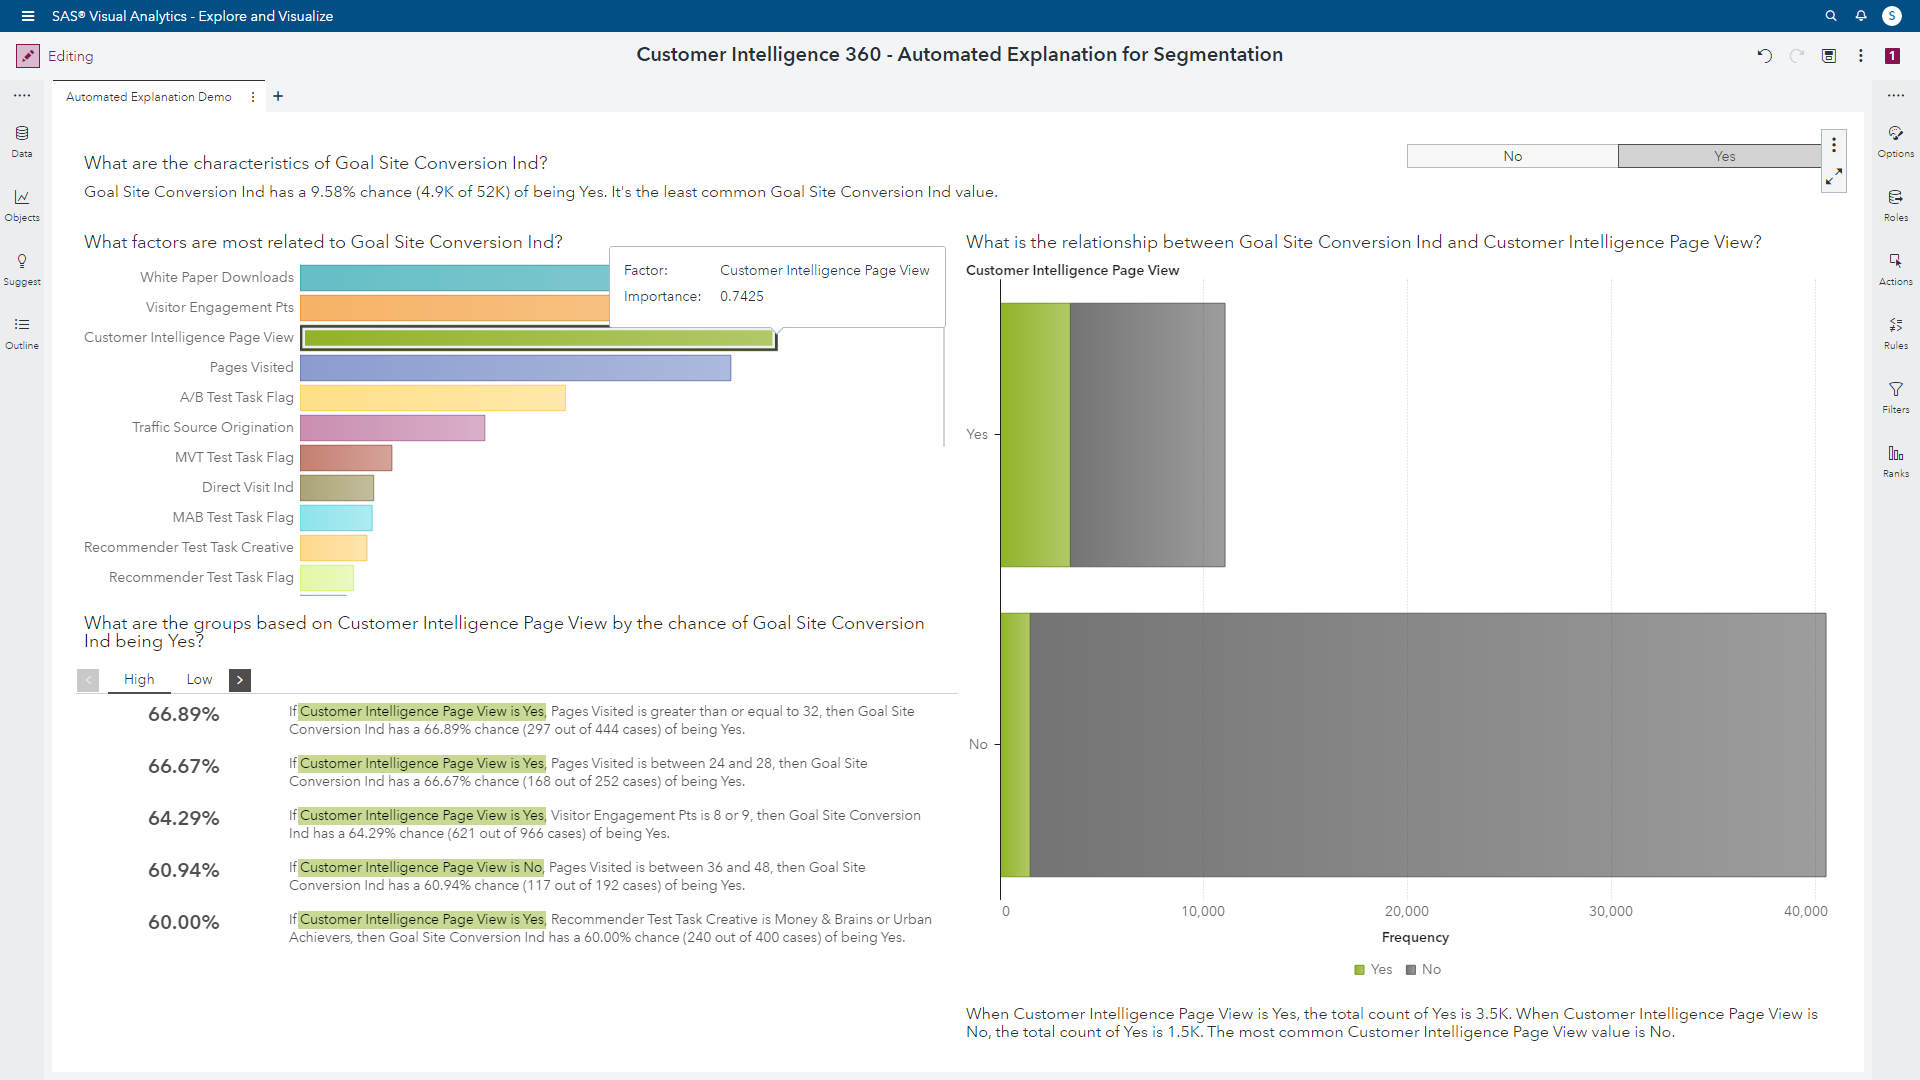
At the top of the page, a natural language generated overview of Goal Site Conversion Ind is displayed, including the percentage of observations that converted, as well as comparative details to other values represented within this attribute’s distribution.
Below the overview text section, color-coded factors on a horizontal bar chart are visualized displaying the relative importance of each attribute’s influence of Goal Site Conversion Ind. The most important predictors appear on the top, listed in descending order by weight. The weights are determined by one-level algorithmic decision trees. Hovering over each bar interactively generates a pop-up display of the relative importance score standardized between one and zero to simplify interpretation (higher values equate to more influence).
Now that an analyst knows which factors influence Goal Site Conversion Ind, how can they determine which data values of these important factors lead to higher or lower conversion propensities? When a data item like Goal Site Conversion Ind is selected to be analyzed, the automated analysis results display a list of attractive segments. These homogeneous groups receive natural language descriptions based on recipes of influential factors with specific values.
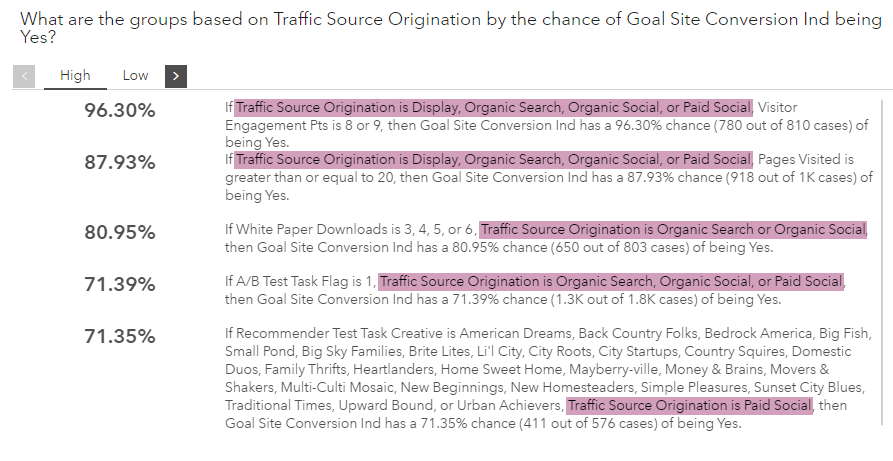
In the provided example, multi-level (as opposed to single-level) C4.5 decision trees are executed to identify each of the segments performing at high conversion rates, and analysts can review the explanations to assess the audience profiles. Since the factor Traffic Source Origination was selected, all influential values related to this attribute are contextually highlighted in purple. Not only does the analyst see the impact of the selected factor, but also how other factors interact with it to identify high value segments.
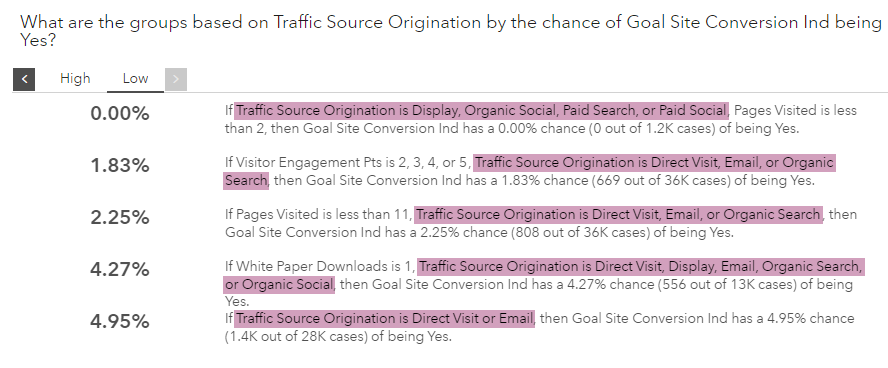
Alternatively, if an analyst is interested in low value segments, clicking the Low filter will present those audiences.
Moving on, analysts will want to explore the bivariate relationships of factors with Goal Site Conversion Ind in more detail to assist in both interpretation, and presentation storytelling. The last visualization appears on the right side of the report highlighting the interaction effect of a selected factor with Goal Site Conversion Ind.
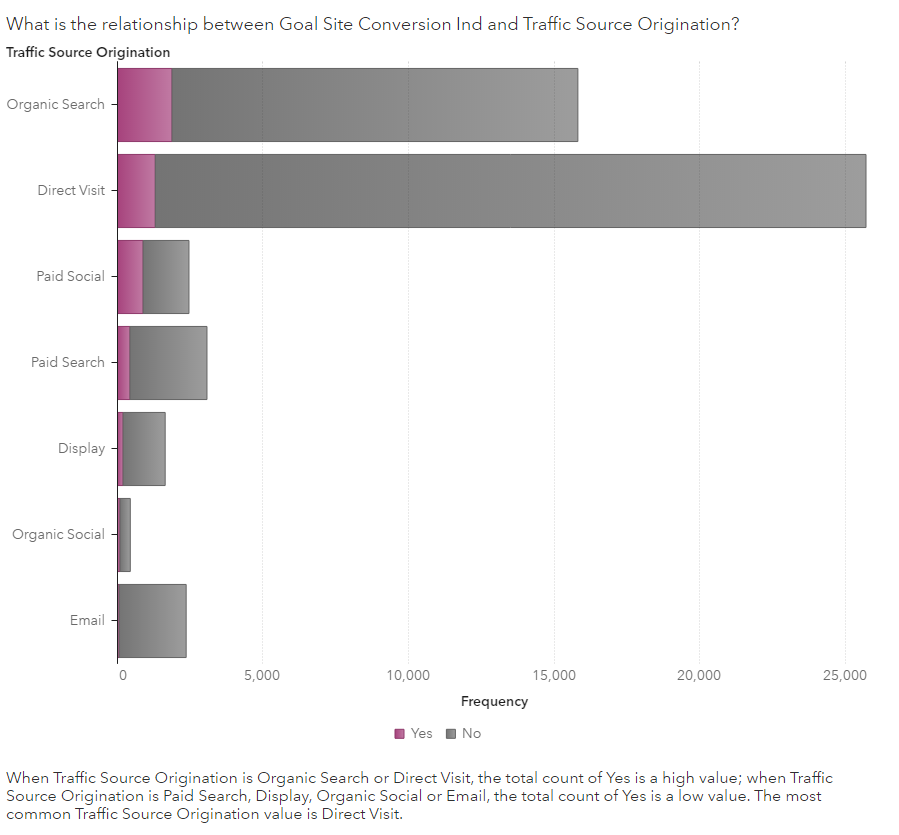
Users can review the natural language explanations of the visualization, and also interactively select other influential factors. In the example below, I proceeded to select the factor Customer Intelligence Page View, and the report changes other visualizations to improve my understanding of the influence it has on Goal Site Conversion Ind, as well as it’s impact to identifying attractive segments.
Takeaways
SAS’s vision is to help marketers be effective through analytic techniques. Segmentation can be performed in a variety of ways. By using the deep library of algorithms available within SAS Customer Intelligence 360, machine learning can be embraced, rather than resisted, to create relevancy through data-driven personalization.
In part two of this blog series, we'll continue to explore examples of automated AI augmenting human analysis abilities in deriving insight from data. Part three will conclude focusing on the deployment (or taking action) of this process with considerations for modern marketing.

3 Comments
Pingback: SAS Customer Intelligence 360: Automated AI and segmentation [Part 2] - Customer Intelligence Blog
Pingback: SAS Customer Intelligence 360: Automated AI and segmentation [Part 3] - Customer Intelligence Blog
Pingback: SAS Customer Intelligence 360: Hybrid marketing and analytic's last mile [Part 1] - Customer Intelligence Blog