In Part 1 and Part 2 of this blog posting series, we discussed:
- Our current viewpoints on marketing attribution and conversion journey analysis in 2017.
- The selection criteria of the best measurement approach.
- Introduced our vision on handling marketing attribution and conversion journey analysis.
We would like to conclude this blog series by sharing our thoughts, rationalization, and new capabilities within SAS Customer Intelligence 360 to support rules-based and algorithmic marketing attribution in conjunction with interactive conversion journey analytics.
SAS Customer Intelligence 360 approach
The first area to consider is attribution. We recognize that attribution is a mature market and that there are incumbent vendors with years of experience. However, organizations still believe they have an attribution problem. There are numerous reasons for this (here is an example). The reality is many organizations have customers or prospects who often fly under the radar across the interaction landscape. We believe the way forward is to build an evolving, comprehensive picture in the visible areas of consumer data and expand this view as new touchpoint data becomes available.
Our approach to attribution is to take first-party marketing data to find the best possible way to apportion credit to the different touchpoints while considering interaction and timing effects. We use an approach that includes rules- based attribution, but the focus is on our algorithmic method, which we will refer to as analytic attribution.
Analytic attribution
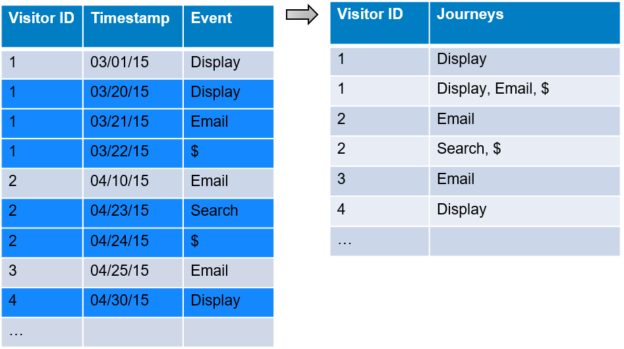
We have developed an analytic approach that is channel-independent. The data can come from any touchpoint, provided it fits into a transactional format. SAS Customer Intelligence 360 considers traffic originations as well as internal promotions when calculating share of conversion credit. Data processing is automatic and uses a transactional stream representing, for each user ID, a time-stamped sequence of interactions across the different touchpoints as shown below.
The first part of the analysis is to identify the distinct journeys contained in the data. From these journeys, we determine which lead to conversion and (equally important) which do not.
We use a machine learning technique to compile the journeys, looking for the strength of associations in the data that link different touchpoints together. This is not dependent upon there being a conversion, unlike rules-based methods that use a conversion as the end point. This is important because we need to be able to compare touchpoint roles in cases where a journey converts to those where there is no conversion.
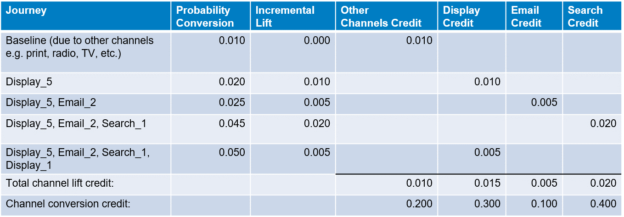
For the analytically inclined, these journeys form the analytic base table (one row per journey) used as the input data view for the attribution analysis. The individual touchpoints become the predictors with values for each row based on the number of times that touchpoint was seen in the visitor journey. What you are trying to predict is the final column – a “1” indicates the journey converted and a “0” means it didn’t. The resulting machine learning model is used to identify the contributions that different touchpoints made to overall conversion. SAS uses an iterative method to calculate incremental lift from touchpoints to determine attribution weights.
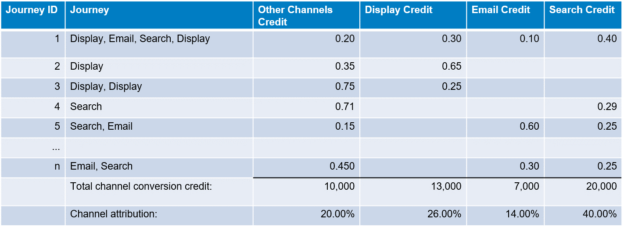
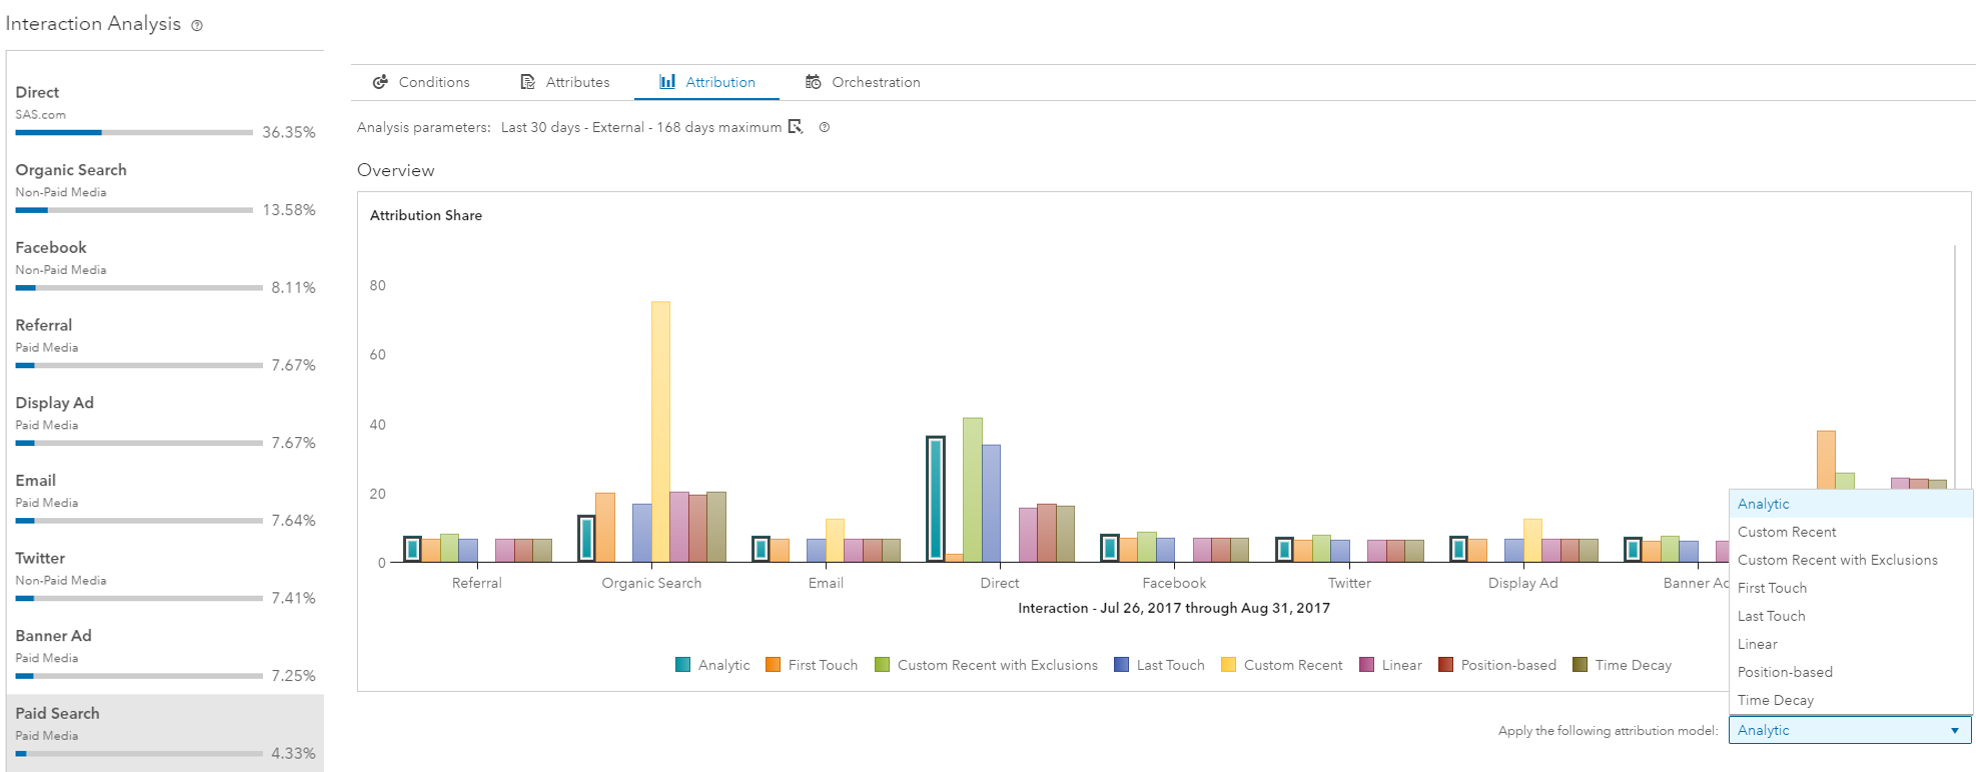
All identified journeys are used to calculate the final conversion credit. In the chart above, you can see that display advertising gets credited with driving 26 percent of the conversion.
Journey analytics and timing
What this picture doesn’t show is any indication of the sequence or timing of interactions. Our approach to including sequencing is to further refine the input data. Instead of simply having the sequence "Search then Email" as a journey, we differentiate based on the time between the two items. We end up with many more predictor columns, each one relating not just to a touchpoint, but also to the time delay.
Touchpoint interaction
Another effect in the attribution model is the interaction between the different touchpoints. The principle of how we tackle this is the same as it is for time-based attribution in that we create new predictors as inputs to the model based on finding relevant combinations of channels. We use a statistical modeling technique to detect the presence and validity of interactions, rather than simply binning and counting. We combine variables in the analytic base table that include both the time dependency, as well as identifying the main interaction effects.
Putting it all together
We have talked about what we should do and how we go about it. Up to now, we haven’t given attention to how the story ends.
Marketers have expectations about what they see as output from attribution analysis, and SAS Customer Intelligence 360 Engage offers easy-to-understand reporting views for each defined channel. Analysts can also compare the results from any rules-based method with algorithmic attribution. Iterating different courses of action, based on comparisons, can help build confidence in analytic methods, or at the very least help choose the best rules-based method.
Interaction journey analysis
The really exciting piece is how we are using attribution as a first step into journey analytics and, ultimately, to customer journey optimization. Being able to credit paid search marketing with 4.3 percent of conversion revenue is useful to know, but leads to more questions:
- What conversion journeys included paid search?
- Where in the journey did paid search touch the customer?
- What is the best timing between a paid search interaction and others?
- What types of customers included touches with paid search, and how do they differ from those that didn’t?
Our new Interaction Journey Analysis feature answers these questions and more. For each channel, we can discover:
- The top conversion paths that include the channel.
- The relative contribution of that channel in any given conversion path.
- The relative position of that channel in the conversion path.
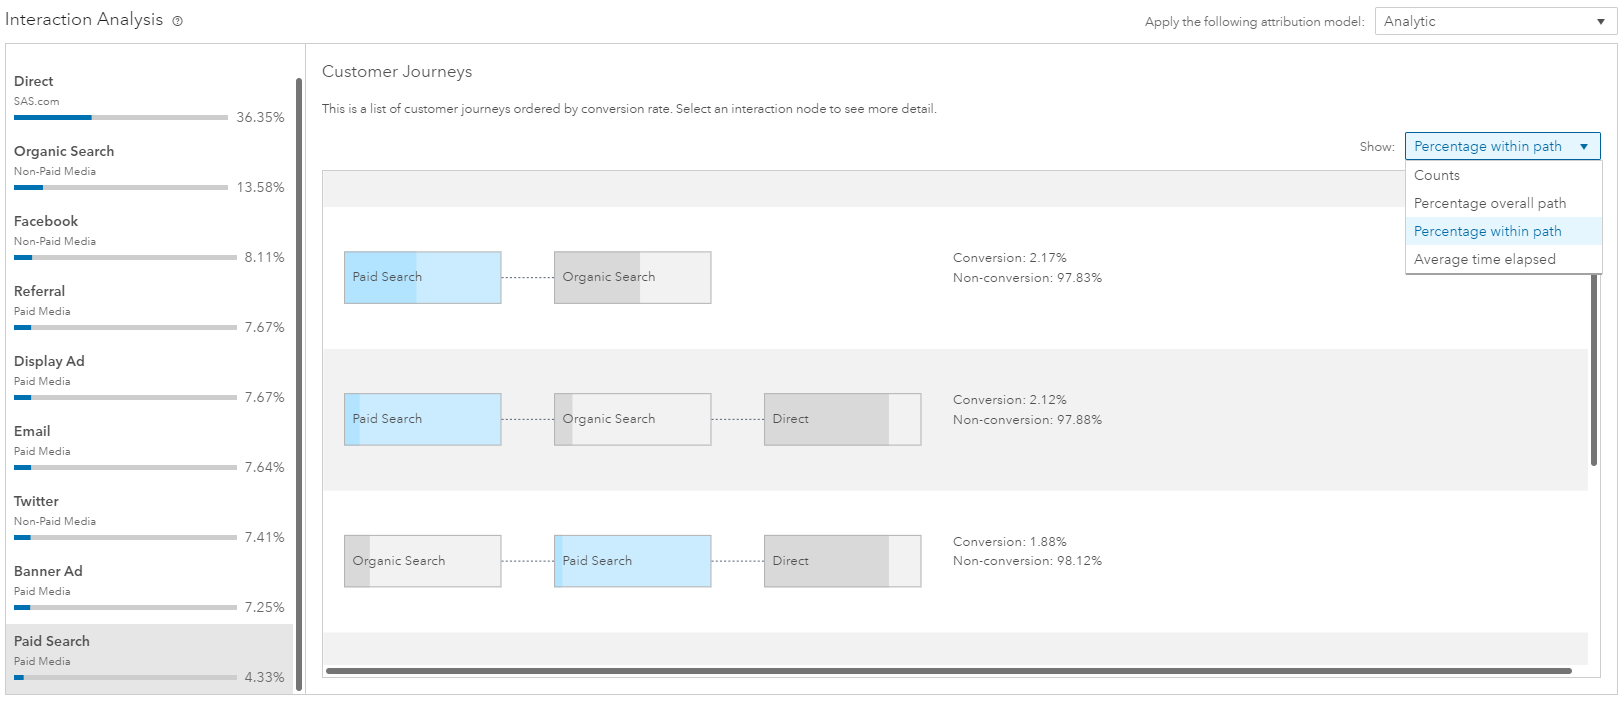
In the image above, selecting paid search in the left pane displays the top paths that include paid search (on the right). The shading within each channel in a path shows its relative importance for that specific path. And, of course, its position in the conversion path lets you know whether it played more of an acquisition or a closing role.
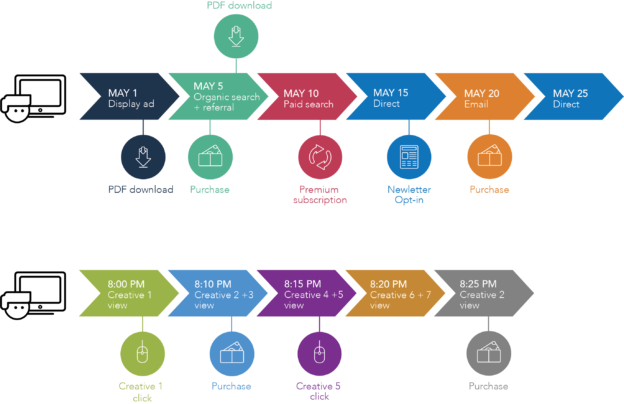
Path timing
There is one last item worth mentioning, and that is the ability to visualize timing effects in conversion path analytics.
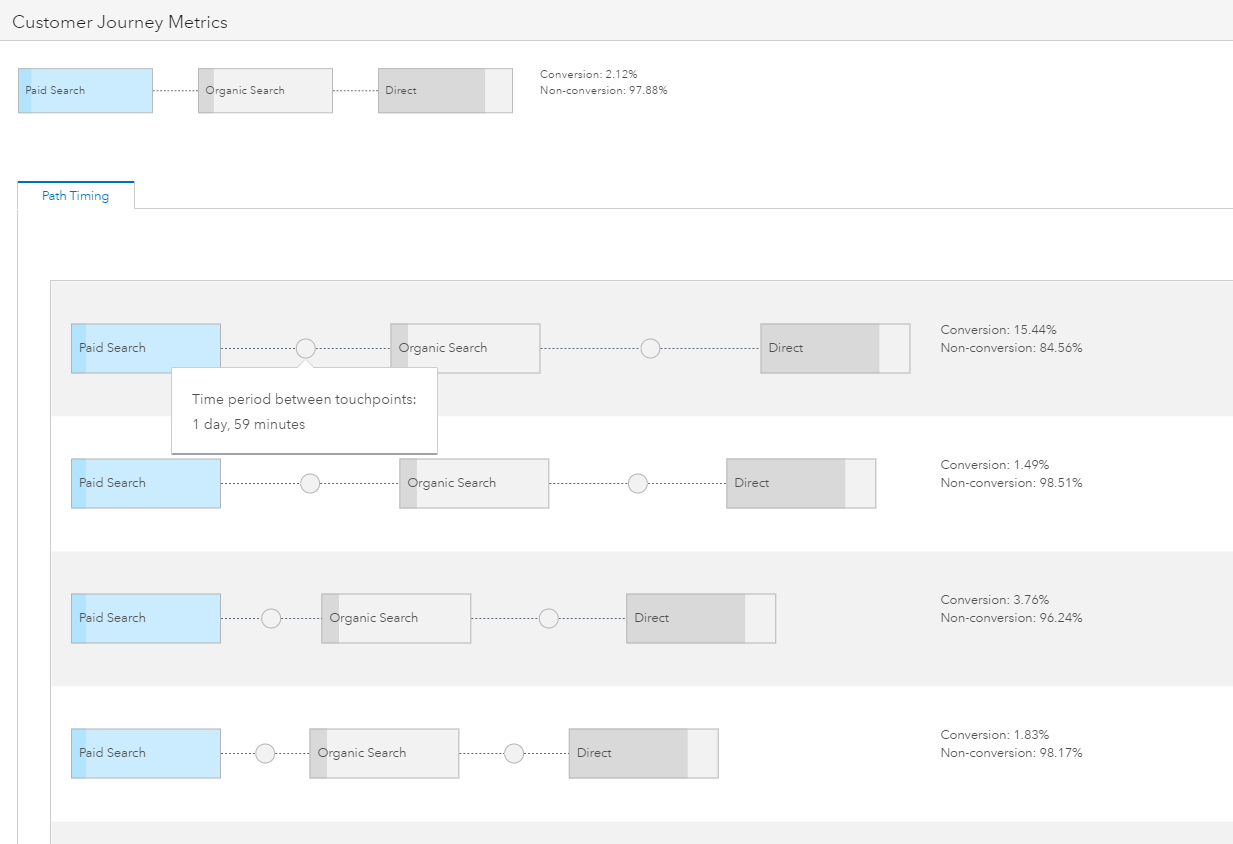
In the picture referenced above, there is a single conversion path (shown at the top), and below that is the breakdown into different sequences depending on the timing between components. This ability to discover natural path cadences is invaluable for the marketer looking to improve the efficiency of journeys.
Takeaways
Our initial attribution release in SAS Customer Intelligence 360 showcases our analytic strengths and reinforces our vision to be the leader in bringing advanced techniques to the digital marketer. It's analogous to self-driving automobiles. These techniques represent the first step in a journey that aims to link the rear-view mirror (think traditional attribution) to forward sensors (predictive journey optimization) to provide advanced driver assistance capabilities.
At SAS, we are passionate about customer journey optimization. It is exciting to see artificial intelligence approaches such as reinforcement learning emerging in our product development cycles. We will continue to innovate and support the evolving needs of marketers by embracing machine learning and artificial intelligence, because at the end of the day, analytics is the heartbeat of modern organizations.
This blog post was authored by Malcolm Lightbody (SAS Customer Intelligence Product Management) and Suneel Grover (SAS Principal Solutions Architect).

1 Comment
Pingback: SAS Customer Intelligence 360: Hybrid marketing and analytic's last mile [Part 1] - Customer Intelligence Blog