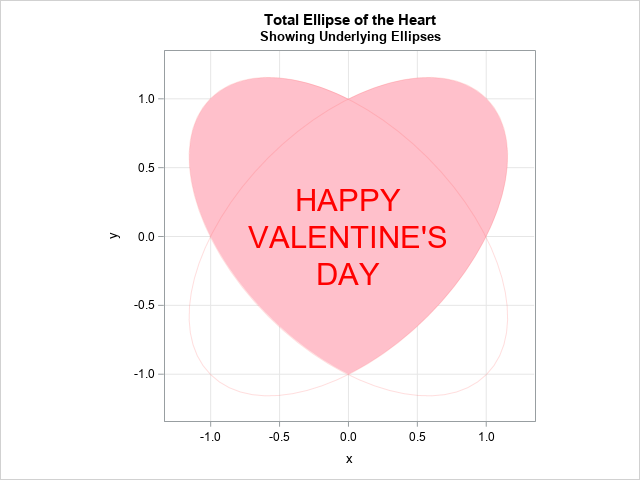
Author

Rick Wicklin
RSS
Distinguished Researcher in Computational Statistics

Rick Wicklin, PhD, is a distinguished researcher in computational statistics at SAS and is a principal developer of SAS/IML software. His areas of expertise include computational statistics, simulation, statistical graphics, and modern methods in statistical data analysis. Rick is author of the books Statistical Programming with SAS/IML Software and Simulating Data with SAS.

Rick Wicklin 0
Finding the root of a univariate function

At the SAS/IML Support Community, a SAS/IML programmer recently asked how to find "the root of a complicated equation." That's a huge question, and many papers and books have been written on the topic of root-finding, also known as finding the zeros of a function. Everyone has favorite techniques for

Rick Wicklin 0
Options for Printing a Matrix

A matrix is an array of numbers or character strings. When I print a matrix, I usually want to see only the data. However, sometimes it is helpful to add row or column headings that indicate the names of variables or labels for rows. A simple example is count data

Rick Wicklin 0
A simple signum function

The other day I needed to compute the signum function for each element of a matrix. If x is a real number, then the sgn(x) is -1 when x<0, 1 when x>0, and 0 when x=0. I wrote a SAS/IML module that contains a compact little expression: proc iml; start

Rick Wicklin 0
How I Know When to Blog

Yesterday, Jiangtang Hu did a frequency analysis of my blog posts and noticed that there are some holidays on which I post to my blog and others on which I do not. The explanation is simple: I post on Mondays, Wednesdays, and Fridays, provided that SAS Institute (World Headquarters) is

Rick Wicklin 0
An easy way to specify dates and times

Dates and times. As Wayne Finley states in his SUGI25 paper on SAS date and time handling, "The SAS system provides a plethora of methods to handle date and time values." Along with the plethora of methods is a plethora of papers on the topic. If you want to trick

Rick Wicklin 0
Simulate categorical data in SAS

As I was reviewing notes for my course "Data Simulation for Evaluating Statistical Methods in SAS," I realized that I haven't blogged about simulating categorical data in SAS. This article corrects that oversight. An Easy Way and a Harder Way SAS software makes it easy to sample from discrete "named"

Rick Wicklin 0
Improving graphs of highly correlated data

If you create a scatter plot of highly correlated data, you will see little more than a thin cloud of points. Small-scale relationships in the data might be masked by the correlation. For example, Luke Miller recently posted a scatter plot that compares the body temperature of snails when they

Rick Wicklin 0
Add a diagonal line to a scatter plot

In my statistical analysis of coupons article, I presented a scatter plot that includes the identity line, y=x. This post describes how to write a general program that uses the SGPLOT procedure in SAS 9.2. By a "general program," I mean that the program produces the result based on the

Rick Wicklin 0
The area under a density estimate curve

Readers' comments indicate that my previous blog article about computing the area under an ROC curve was helpful. Great! There is another common application of numerical integration: finding the area under a density estimation curve. This article provides an overview of density estimation and computes an empirical cumulative density function.

Rick Wicklin 0
Overlaying two histograms in SAS

A reader commented to me that he wants to use the HISTOGRAM statement of the SGPLOT procedure to overlay two histograms on a single plot. He could do it, but unfortunately SAS was choosing a large bin width for one of the variables and a small bin width for the

Rick Wicklin 0
Pre-allocate arrays to improve efficiency

Recently Charlie Huang showed how to use the SAS/IML language to compute an exponentially weighted moving average of some financial data. In the commentary to his analysis, he said: I found that if a matrix or a vector is declared with specified size before the computation step, the program’s efficiency

Rick Wicklin 0
A statistical analysis of coupons

Each Sunday, my local paper has a starburst image on the front page that proclaims "Up to $169 in Coupons!" (The value changes from week to week.) One day I looked at the image and thought, "Does the paper hire someone to count the coupons? Is this claim a good

Rick Wicklin 0
Enumerating levels of a classification variable

A colleague asked, "How can I enumerate the levels of a categorical classification variable in SAS/IML software?" The variable was a character variable with n observations, but he wanted the following: A "look-up table" that contains the k (unique) levels of the variable. A vector with n elements that contains

Rick Wicklin 0
Blogging, programming, and Johari windows

My primary purpose in writing The DO Loop blog is to share what I know about statistical programming in general and about SAS programming in particular. But I also write the blog for various personal reasons, including the enjoyment of writing. The other day I encountered a concept on Ajay

1 44 45 46 47 48 51