All Posts


As part of the Friday's Innovation Inspiration (FII) series, I've decided to present a few SAS techniques and problem solvers that you labeled as innovative or 'inspirational'. These are pretty easy to find: I've done some digging through the Best Contributed Papers. I know you haven't read them all, so
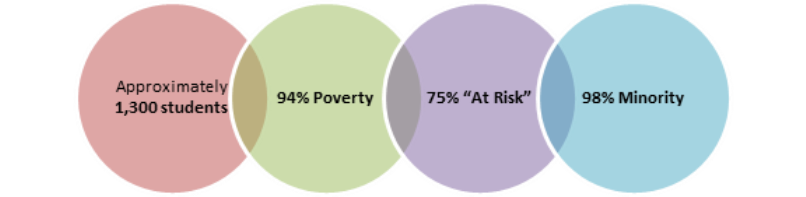

K-12 education reform and policy has seen a recent surge in the cinema with "Waiting for Superman," "The Lottery," and this fall’s "Won't Back Down.” However, if you can’t bring yourself to spend $9.00+ at the box office, or (like me) have a hard time finding babysitters to even get


You’ve just started a new job as SAS administrator, and there’s no documentation. How do you know which SAS products are installed? Where they are deployed? Where do the data and programs reside? Brian Varney tells us that SAS administrators often run into undocumented environments whenever they begin working in a new

The determinant of a matrix arises in many statistical computations, such as in estimating parameters that fit a distribution to multivariate data. For example, if you are using a log-likelihood function to fit a multivariate normal distribution, the formula for the log-likelihood involves the expression log(det(Σ)), where Σ is the

Over the past month or more, I have been in a conversation with SAS user James Marcus, on creation of some new displays for visual communication of uncertainty. These include display of densities using a "Violin" plot, "Density Strips" and more. With his permission, I can share some of the

I work on a variety of projects at SAS, most of which require some level of team collaboration in source management systems. Due to the many technologies that we work with, SAS developers use different source management tools for different purposes. I've got projects in CVS, Subversion, and Git. When


Our SAS Users Group regional road trip is coming to an end. Final destination -Baltimore, MD. That will be the site of the Northeast SAS Users Group regional conference November 11-14. More than 500 users are expected to come together to share ideas, learn from experts, and increase their SAS


BASE SAS users are already familiar with the autoexec file. This is a .sas file that typically resides in the installation folder of the SAS executable. Instructions for setting it up in UNIX, Windows, and other environments is readily available on the SAS website. In SAS BI configurations there are
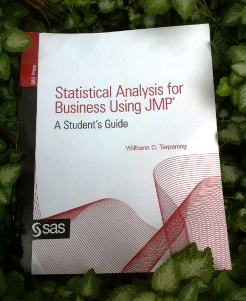

This week's tip is from Professor Willbann D. Terpening and his book Statistical Analysis for Business Using JMP. If you're intrigued by the following excerpt, visit Terpening's author page for additional bonus book content. And take a look at his previously featured tip The Student t-distribution, on this blog: The following excerpt is from


What do disaster planning and baseball have in common? (Cue Cubs fans, "We plan on every season being a disaster!") Bear with me... Watching game 1 of the World Series reminded me of the time I took my son to AT&T Park to see the Giants play. It was the day

Never been to Houston? November 5-6 is perfect for your first trip. Make plans to see some of what the fourth-largest city in the US has to offer; there are some famous visitor destinations - and some not well-known. The South Central SAS Users group is holding its annual SAS Educational Forum in this
It's hard to get away from data these days, especially Big Data. The news is full of stories about how fast it's accumulating, about technologies for capturing and analyzing it, and about the creative ways organizations are using it. Pundits have even dubbed personal data the “new oil” that will


Trick or Treat! Halloween and its endless candy supply marks the beginning of a continuous stream of social gatherings, family meals, and tempting holiday foods from October to January. For many, this also means unwanted extra pounds. However, you can still enjoy Halloween without breaking the calorie bank; you just

While 2012 has been a very active hurricane season in terms of total storms, the effects on life and property have been relatively small and the need for disaster recovery less than many years. Let's all be thankful for that. Right now, Tropical Storm Sandy is threatening Jamaica and the

In my 26 plus years of experience, I would contend that the best SAS administrator would be an individual with a deeply skilled understanding of server and/or desktop administration, as well as SAS software usage.