All Posts


Here’s a great way to kill a conversation at the next cocktail party you attend. Start talking about the US budget deficit. You remember the deficit, right? It’s the difference between what the government collects and what it spends. In 2014, the US federal government spent $488 billion more than
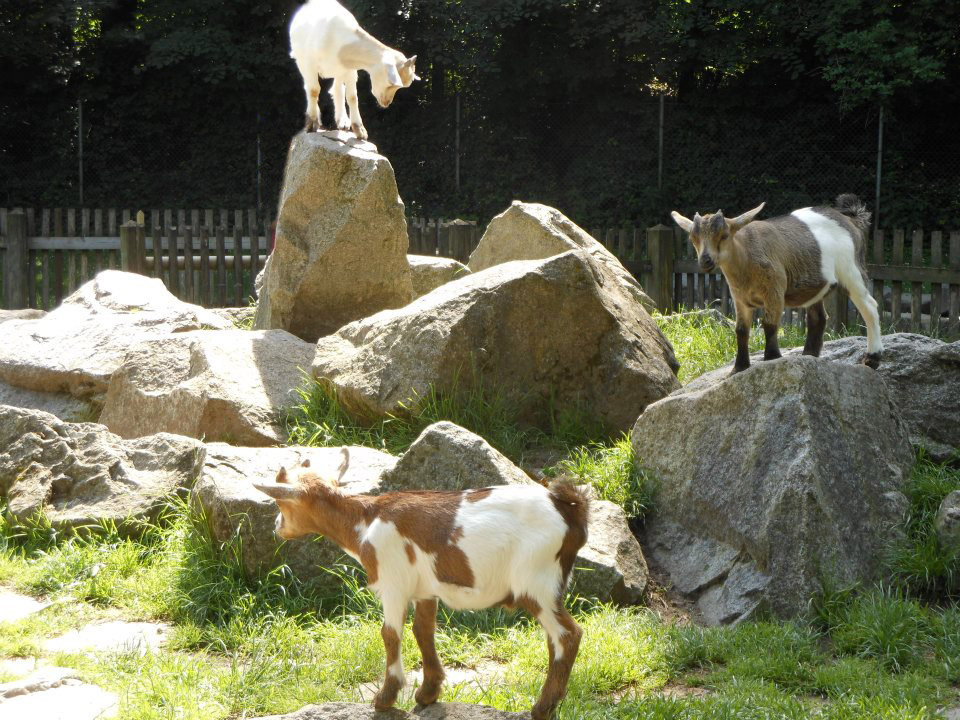

Is this blog post about techniques to use on difficult graph legends, or is it about goats? The answer is both! But first, to get you into the proper mood, here is a picture my friend, Mark, took of some cute goats. And some links to YouTube videos about goats
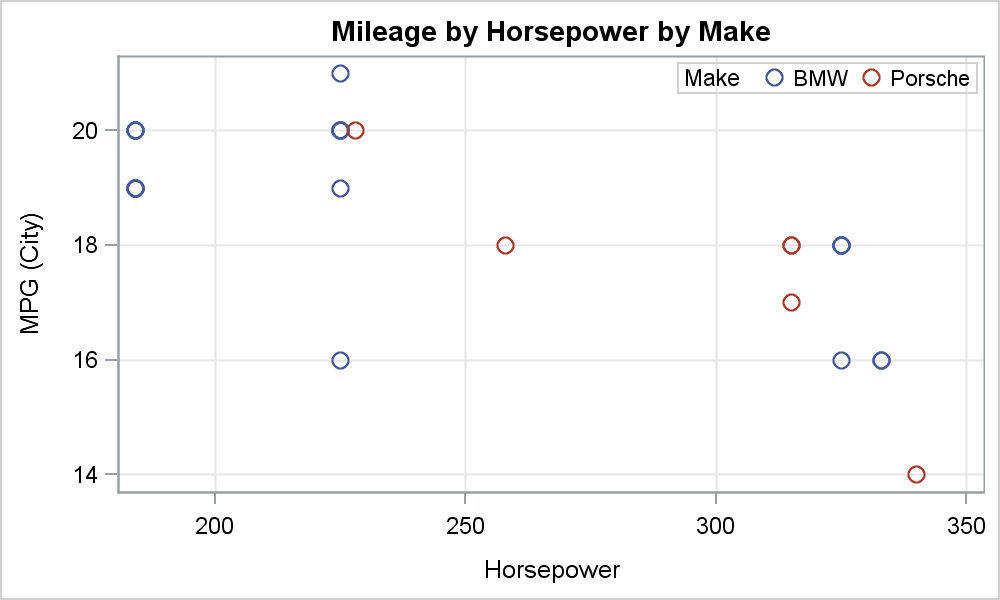

There has been much discussion on the SAS Communities page on usage of different symbols in a graph. The solutioin can vary based on the SAS release. New features have been added at SAS 9.4 releases to SG Procedures and GTL that make this very easy. With SAS 9.4M1, almost any combination is
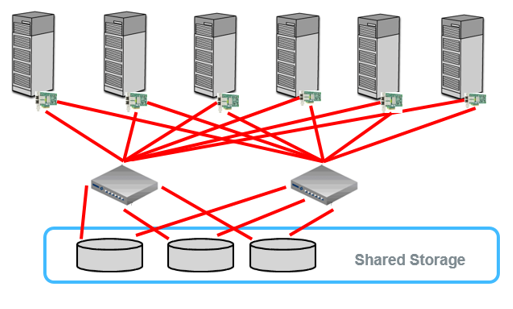

When designing a SAS Grid Manager architecture, there is a requirement that has always been a critical component: a clustered file system. Over the years, vendors have released versions of these systems that are more robust and SAS has increased the minimum IO requirements, but the basic design has never changed—until now.


Healthier Alternatives to Quench Your Thirst With research linking sugar to heart disease, diabetes and GI imbalances, many of us are trying to reduce or eliminate sugar. And to add salt (or sugar) to the wound, new studies are suggesting that some artificial sweeteners ALSO have negative health consequences. When
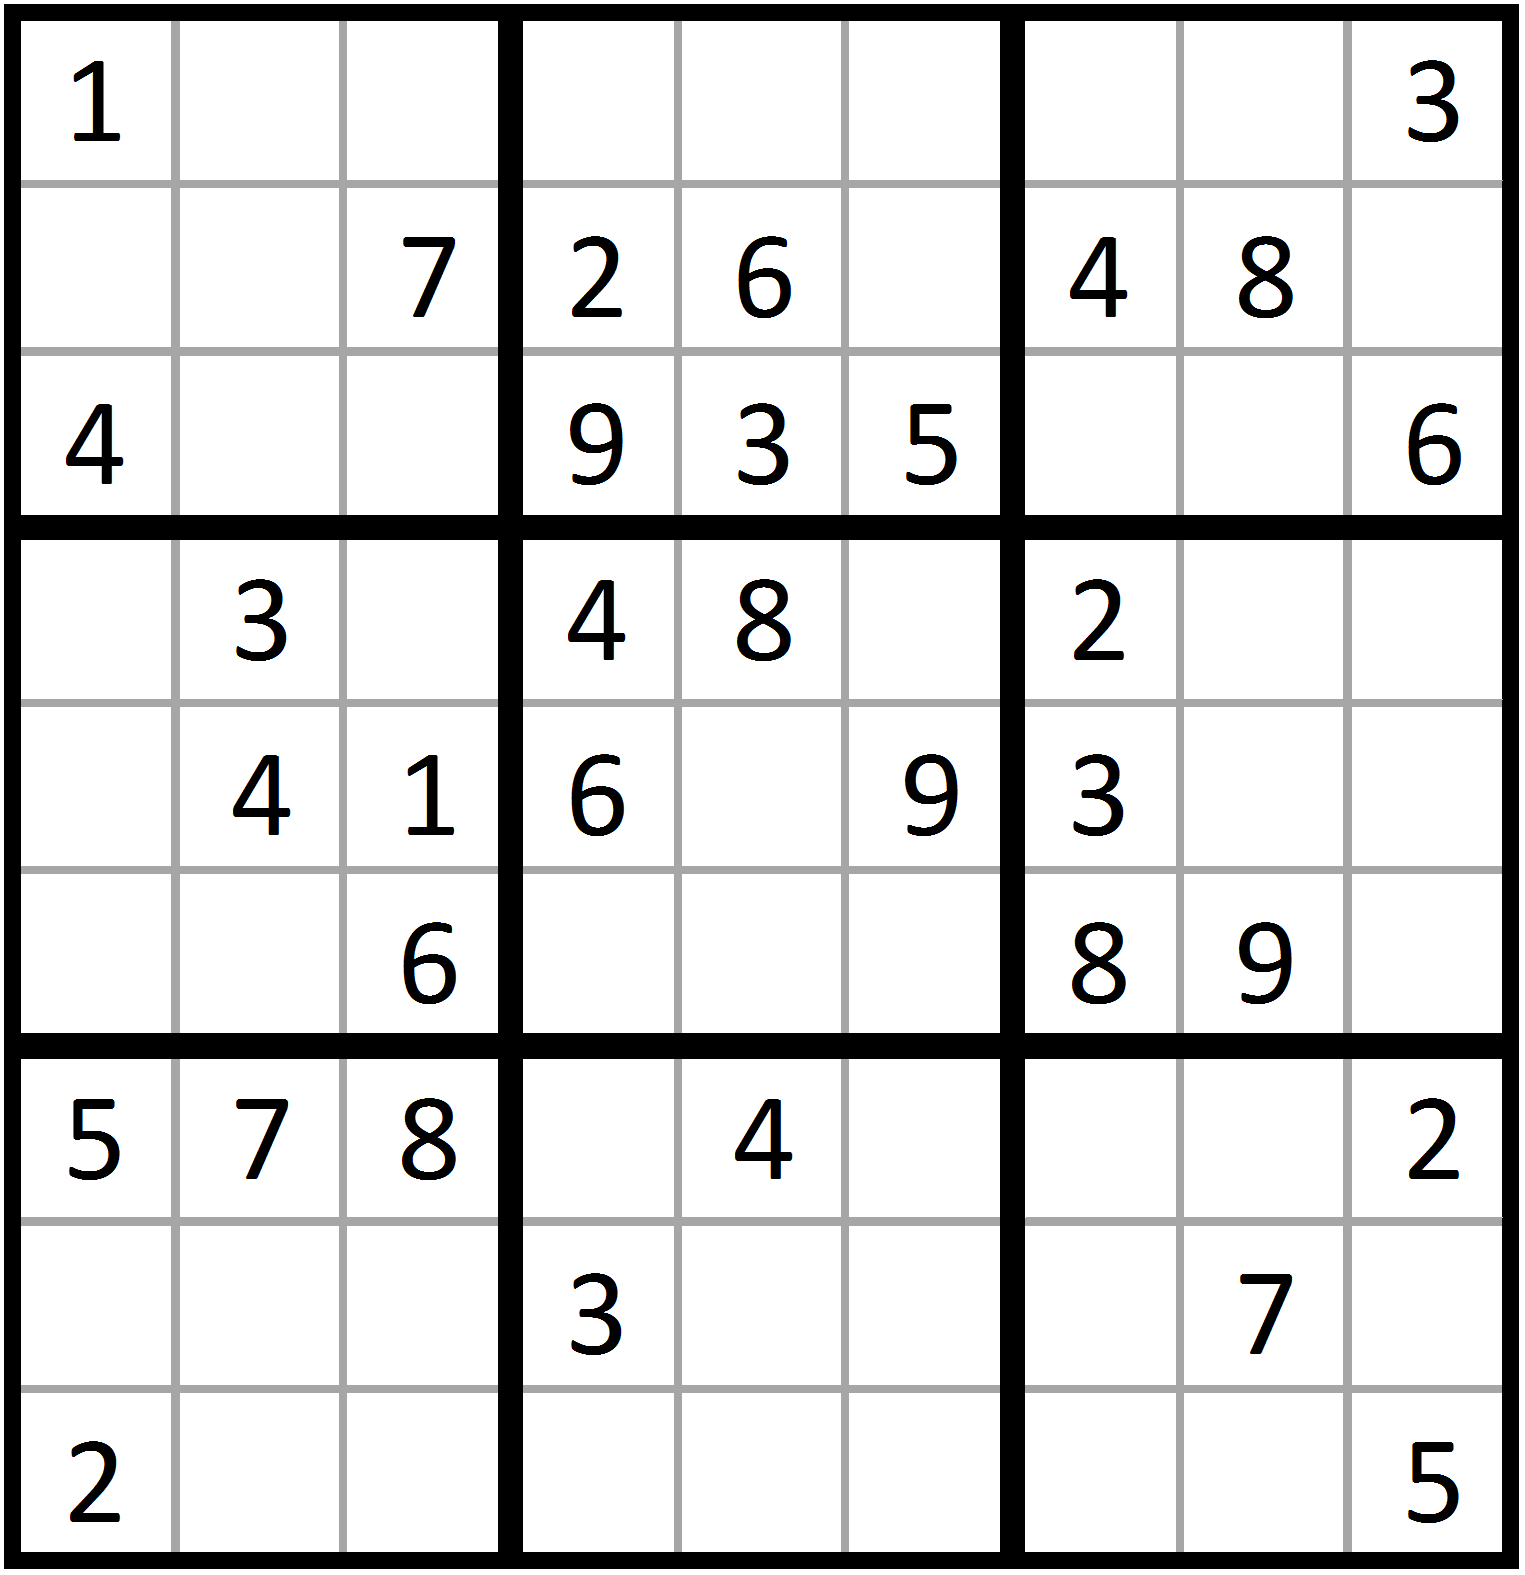

Sudoku solvers have been written in SAS using a variety of methods (e.g., the DATA step, PROC SQL, and PROC CLP). Surprisingly, SAS/IML appears to have been overlooked for this purpose. On a challenge from a coworker, I wrote this blog post to demonstrate the flexibility of SAS/IML in the

James Surowiecki wrote a book about The Wisdom of Crowds. Jeff Howe, who co-coined the term crowdsourcing, wrote a book about Why the Power of the Crowd Is Driving the Future of Business. In this blog series, I explore if it’s wise to crowdsource data improvement, and if the power of the crowd can
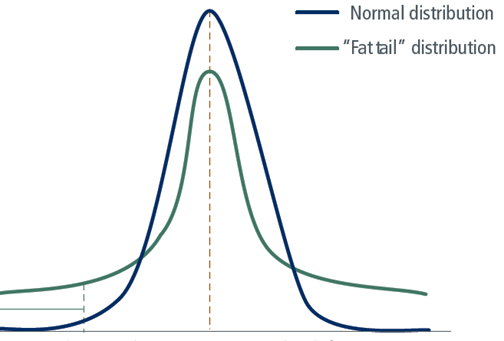

“Let’s assume a normal distribution …” Ugh! That was your first mistake. Why do we make this assumption? It can’t be because we want to be able to mentally compute standard deviations, because we can’t and don’t it that way in practice. No, we assume a normal distribution to simplify

I recently read an article that listed the 100 best restaurants in the US - but the article didn't have a map. I decided to use my SAS skills to change that! When it comes to restaurants, I eat out a lot (and by 'a lot' I mean I never

.@philsimon on the different folks you'll encounter in many large organizations.


~ This article is co-authored by Binod Jha, Global Product Manager for Insurance Solutions at SAS, and Amol Kokane, Senior Development Manager for Insurance & Risk Management Solutions at SAS ~ How might insurance policies change if sensor data could be automatically transmitted and analyzed from your car, your home and even your


By now you have seen dozens of articles with trends and predictions for what the hospitality industry should expect in 2015. I’m not going to add to those, or rehash them exhaustively here. You’ve all probably read them yourself and gathered the highlights: optimism, more acquisitions, transaction volumes will stay


I cannot speak from experience, but predominately an Insurance CEO has three primary objectives: Grow the business Reduce expenses Ensure compliance. Let’s individually consider each of these objectives in more detail. Grow the Business How does an insurance company grow from a $2bn to a $3bn organization? Essentially, insurance has


With the growing use of SAS on commodity hardware, many organizations are running lots of SAS servers on separate instances of operating system in a SAS infrastructure. This configuration is great for optimizing resources, but when these SAS servers have to share data, then SAS recommends the use of a clustered


El inicio de año siempre es ideal para evaluar qué no ha funcionado tan bien como nos gustaría, hacer un inventario para saber qué tenemos y que nos falta, comprobar algunas hipótesis que teníamos pendientes, ampliar nuestra perspectiva sobre lo que está aconteciendo en el mundo y por qué no,