All Posts
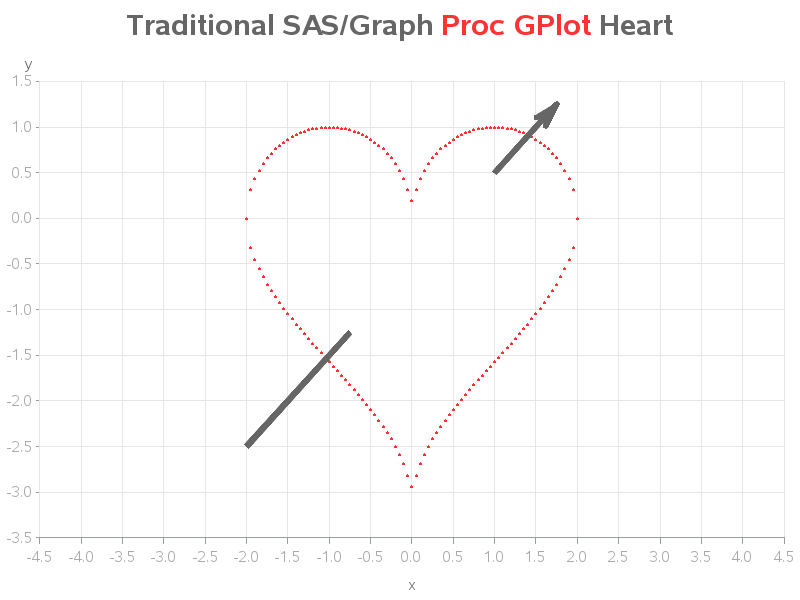

Nobody puts an arrow through a heart any better than Sam Cooke & Cupid ... but SAS/Graph comes close! If you've been following my blog, you know that my favorite of all the SAS Procedures are the traditional SAS/Graph Procs, such as GPlot and GMap. They're rock-solid reliable, and flexible


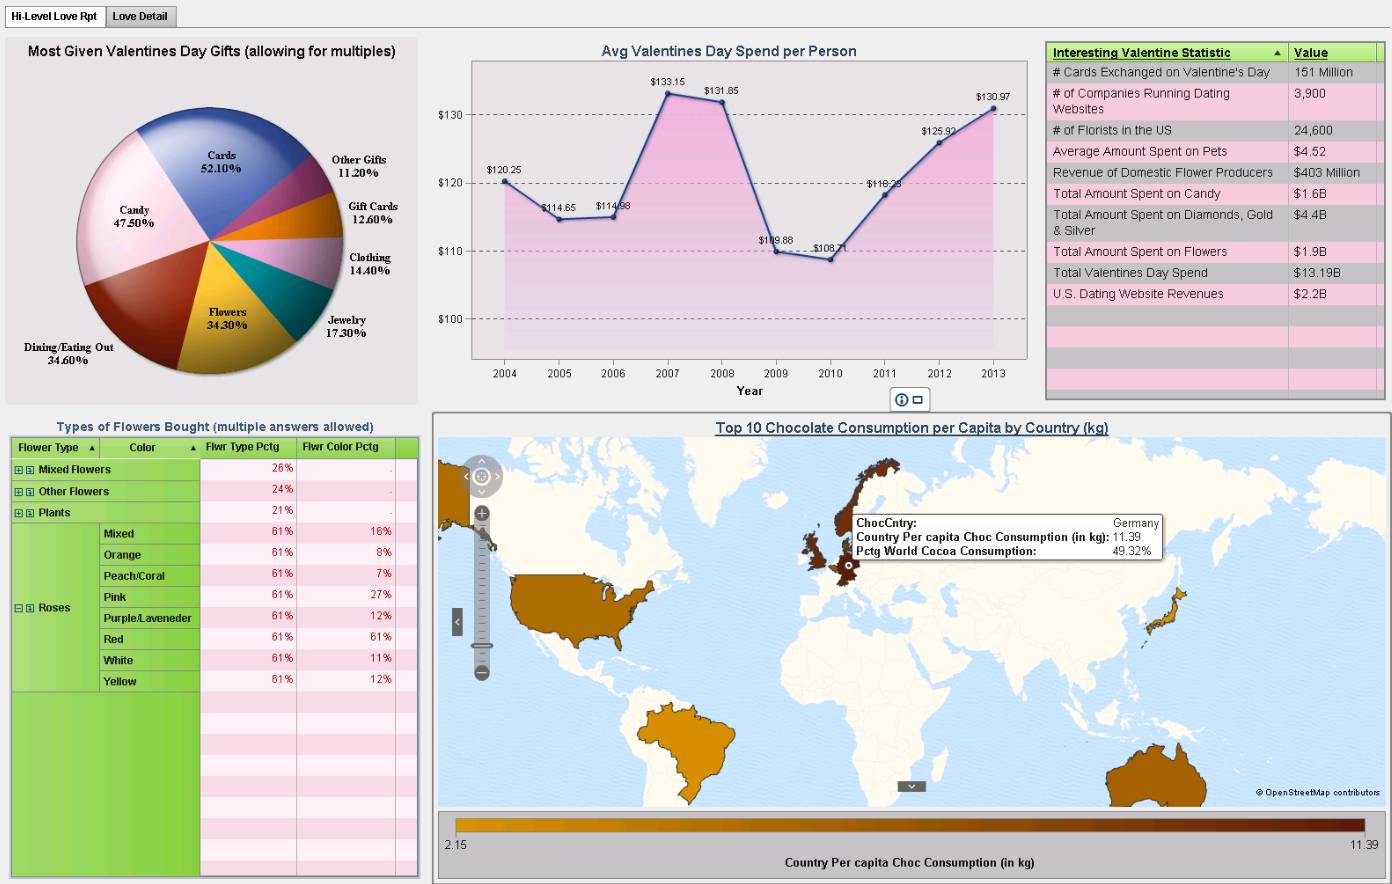
Love is in the air and things are starting to heat up for Valentine’s Day. OK—maybe not for Connecticut and the rest of the northeast buried in another foot of snow and more on the way! Perhaps some stories of love could help melt the ice away. They’re happening every


Business analytics is about dramatically improving the way an organization makes decisions, conducts business and successfully competes in the marketplace. At the heart of business analytics is data. Historically, the philosophy of many insurers has been on collecting data, data and more data. However, even with all this data, many

Look, I’ve been at this game a long time. I set Cleopatra and Marc Antony on a path to ruin. I set J-Lo and Marc Anthony on a path to eternal happiness … until they bought a stake in the Miami Dolphins. No one escapes that dumpster fire unscathed. My


SAS Global Forum brings together the most die-hard SAS users, both veteran and novice, once a year. It’s one of those can’t-miss events, and each year it just gets better. 2015 will bring us all together in Dallas, Texas for several days of active learning and excitement from SAS users

In this blog series, I am exploring if it’s wise to crowdsource data improvement, and if the power of the crowd can enable organizations to incorporate better enterprise data quality practices. In Part 1, I provided a high-level definition of crowdsourcing and explained that while it can be applied to a wide range of projects
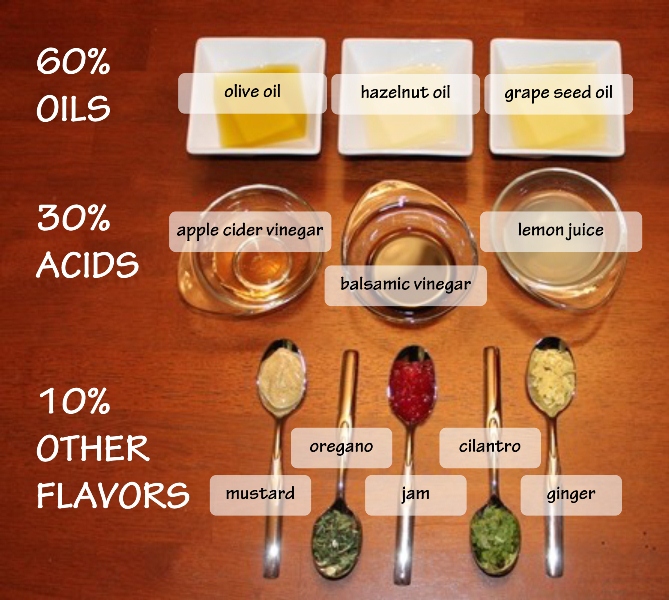

Have you ever sprinkled sugar over your salad? Probably not, but as it turns out food companies have already done it for you! Dressings can have up to a whopping 2 teaspoons of sugar in just 2 tablespoons- that’s 1/3 of your recommended sugar for the entire day. Wouldn’t you rather

.@philsimon on the reliability of social numbers.


We’re all about numbers here at SAS. So when the Global Certification program hit its 75,000th credential – we had to make it a big deal. We tracked down the 75,000th credential holder to Susan Langan, a research analyst in Maryland, and what’s even more special than Langan holding the

Once in a while, people run into an issue with the data that doesn't really need to be fixed right to ensure success of a specific project. So, the data issues are put into production and forgotten. Everyone always says, “We will go back and correct this later.” But that
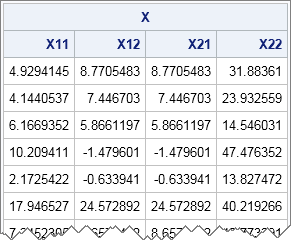

The SAS DATA step supports multidimensional arrays. However, matrices in SAS/IML are like mathematical matrices: they are always two dimensional. In simulation studies you might need to generate and store thousands of matrices for a later statistical analysis of their properties. How can you accomplish that unless you can create


Suppose someone needs a kidney transplant and a family member is willing to donate one. If the donor and recipient are incompatible (because of blood types, tissue mismatch, and so on), the transplant cannot happen. Now suppose two donor-recipient pairs A and B are in this situation, but donor A


According to a 2012 report, it was estimated that over the next five years the US Internal Revenue Service (IRS) will issue more than $20 billion in potentially fraudulent tax refunds. Figures like this do little to boost taxpayers’ confidence in our nation’s tax system. And tax fraud is not

I'm ramping up my visualization skills in preparation for the next big election, and I invite you to do the same! Let's start by plotting some county-level election data on a map... To get you into the spirit of elections, here's a picture of my friend Sara's dad, when he was

Because finding analytical talent continues to be a challenge for most, here I offer tips 5, 6, and 7 of my ten tips for finding data scientists, based on best practices at SAS and illustrated with some of our own “unicorns.” You can read my first blog post for why they