All Posts
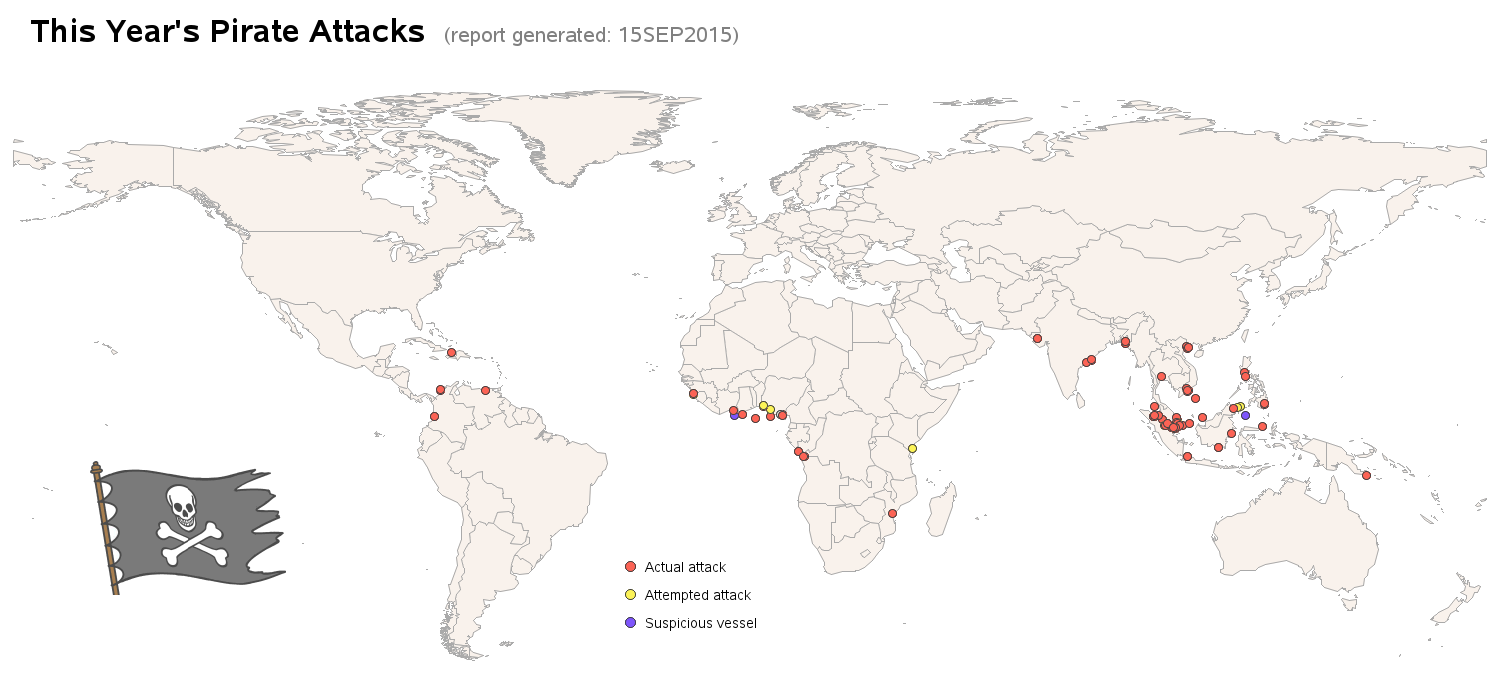

I just returned home from an expedition/adventure boat trip to Cuba, and Talk Like a Pirate day is coming up this Saturday - what a combination for an interesting blog! I hope you enjoy a few pictures, and a bit of data analysis on these topics! A couple of weeks ago,

In the UK, technology trends move a little slower than for our US counterparts. It was about 5 years ago when I first met a data leader at a conference on this side of the pond who was actively engaging in large scale big data projects. This wasn’t a presenter
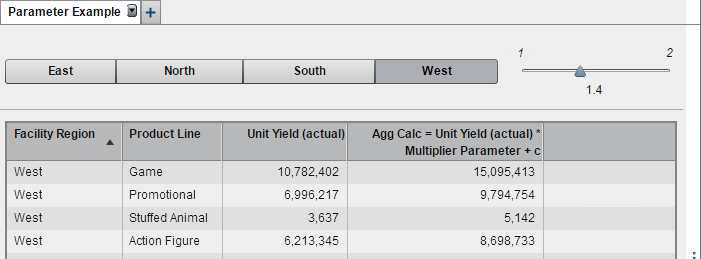

The SAS Visual Analytics 7.2 release introduced context sensitive URLs for VA reports which means we can now directly pass parameter values in the URLs! This opens the door and allows for greater flexibility when needing to use a URL to access a VA report. One use would be if


Among the tightly held cards, piles of chips and bright lights, there have been stories that have unfolded in Las Vegas that have been forever preserved in time, never seeing the light of day. But what if what happened in Vegas…could be shared with excitement with your friends and family?


Close your eyes…inhale deeply...now exhale fully. Absorb the smells, sounds, and sensations all around you. Connect with the ground under you; sense the sky above you. Now open your eyes and enjoy the fullness of the great outdoors! Oh wait! It is likely that you are inside while you are

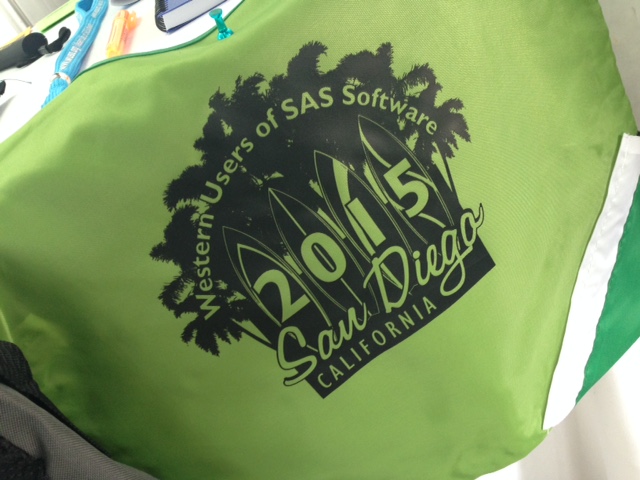
Over 400 enthusiastic SAS users gathered in San Diego September 9-11, 2015 for the 23rd annual WUSS 2015 conference. In this “digital age,” where so much of our communication is virtual and social, it was a treat to get out and meet SAS users face-to-face. The two and a half-days were packed


When I wrote my first paper, a poster for SUGI 13, yes it was SUGI back then, not SAS Global Forum, I had no idea what a wonderful journey I was embarking on. At the time, I thought that paper was just a way to get to a conference. That

Data integration, on any project, can be very complex – and it requires a tremendous amount of detail. The person I would pick for my data integration team would have the following skills and characteristics: Has an enterprise perspective of data integration, data quality and extraction, transformation and load (ETL): Understands

The SGPLOT procedure provides great tools to create all kinds of graphs for all domains from business to clinical. However, every so often, we need to create visuals that are not exactly graphs, but more like flow or network diagrams, or something entirely unique. Some users may have tools to


with Natalie Osborn, Senior Industry Consultant, Hospitality and Gaming Practice, SAS This week, we continue our fall “back to the basics” refresher series on analytics for hoteliers. Last week, in part one, Natalie and I reviewed the analytic methods that can be utilized by hoteliers. This week we will explore


Meet Clark Bradley: SAS technical architect by day and comedian by night. When he’s not demoing SAS Data Loader for Hadoop, he’s blogging about it on The Data Roundtable. Clark and a core SAS team of thought leaders, developers and executives will be in New York City on September 29 at Strata

The benefits of big data often depend on taming unstructured data. However, in international contexts, customer comments, employee notes, external websites, and the social media labyrinth are not exclusively written in English, or any single language for that matter. The Tower of Babel lives and it is in your unstructured

I had the pleasure of speaking at the inaugural “Accounting IS Big Data” conference this past week in New York City, a meeting organized by the American Accounting Association. In addition to giving several talks, I participated in breakout sessions in which attendees discussed how analytics is used to monitor

We’ve all probably done it. It benefits others and yourself. You don’t get paid, but it always makes you feel good. Of course, I’m talking about volunteering. Jennifer Waller’s keynote presentation, “How To Get Your SAS On” was more than just a catchy title. The attendees at WUSS 2015 in
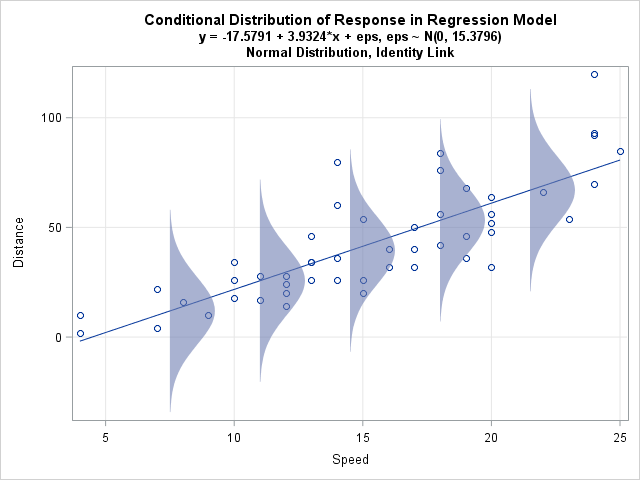

A friend who teaches courses about statistical regression asked me how to create a graph in SAS that illustrates an important concept: the conditional distribution of the response variable. The basic idea is to draw a scatter plot with a regression line, then overlay several probability distributions along the line,