All Posts


Criminal enterprises are tapping into the lucrative opioid business through creative schemes that are less likely to be identified as opioid abuse, misuse or diversion. One of the latest schemes? Auto insurance fraud. First, some background… While extensive progress has been made in establishing, improving, and mandating prescription drug monitoring


On June 22nd, the U.S. Department of Justice announced the largest Medicaid fraud bust in history. The National Health Care Fraud Takedown included 301 defendants charged, $900 million in false billings, 61 medical professionals and 29 doctors, across 36 states. In another case, investigators in New York uncovered more than

Currently, most fraud detection solutions for financial crime and tax fraud are focused on risk assessing entities. That is to say, they evaluate the risk of each individual or businesses separately. While this helps prioritize risk-based investigations by alerting investigators to the likelihood of fraud, it does not necessarily maximize deterrence.
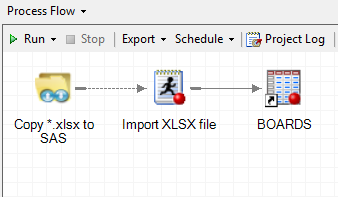

I've supplied dozens of custom tasks for SAS Enterprise Guide, but the Copy Files task is easily the most popular. The Copy Files task allows you to capture "file transfer" steps inside your process flow, so that you can automate any file upload and download operations between your PC and


.@philsimon says don't treat data self-service as a binary.


Tradicionalmente usadas por el sector financiero para gestionar sus riesgos y reducir sus niveles de fraude o por las compañías de servicios para mejorar sus indicadores de servicio anticipándose a las necesidades de sus clientes, las soluciones analíticas han empezado a impactar a las personas desde que se levantan hasta


Meetings, emails, budgets, phone calls, more emails, a meeting that could be an email, an email that should be a meeting – sound familiar? This is a typical work week for most of us. It is easy to get caught up in the next thing on the calendar and lose


La experiencia del usuario es una de las aristas más relevantes dentro de la rentabilidad y ganancias de las compañías -para algunas es la más vital-, sin embargo, es probable que no todas las organizaciones comprendan su importancia o beneficios, por ejemplo, personalizarla. En primer lugar, debemos entender la experiencia
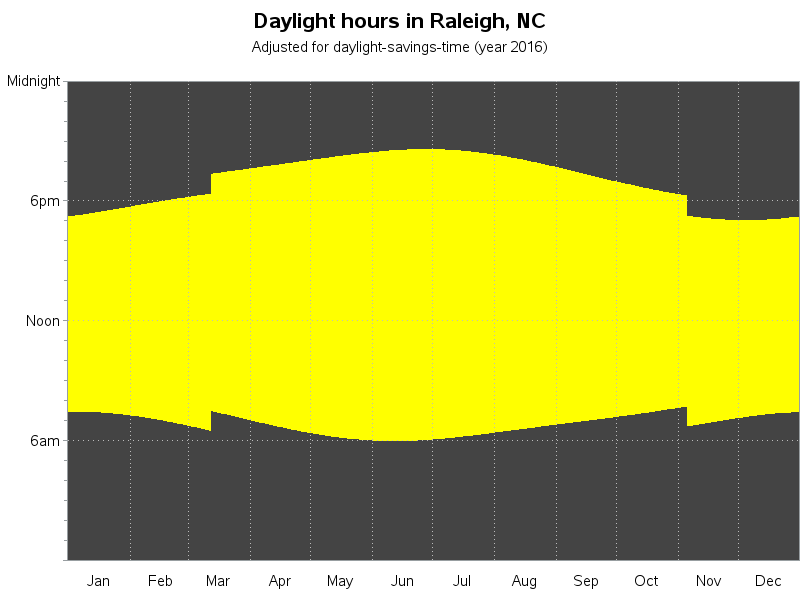

Does it seem like there just aren't enough daylight hours to get things done these days? It might not be that you've got more to do - it might be that we actually have fewer daylight hours in the winter (here in the northern hemisphere). And since "seeing is believing,"


Brings relief to feet, legs and spine. Relaxes the nervous system and cultivates sleep. Legs Up the Wall (Sanskrit: Viparita Karani)


Retail isn't an easy place to be these days. The environment is omnichannel and ever-changing. Competition is rising and retailers are struggling to understand how to best meet customers’ merchandise preferences. Fortunately, analytics are driving profitability and market share for smart retailers. Let’s take a look at the four hottest


The 2016 INFORMS Annual Meeting will be held at the Music City Center and Omni Nashville Hotel in downtown Nashville, TN on November 13-16, with pre-conference events starting on Saturday, November 12. SAS will be a major participant in this conference. Over two dozen people from SAS will attend, with


We often talk about full customer data visibility and the need for a “golden record” that provides a 360-degree view of the customer to enhance our customer-facing processes. The rationale is that by accumulating all the data about a customer (or, for that matter, any entity of interest) from multiple sources, you


The Data For Good initiative is all about using data and analytics to improve the lives of citizens around the world – however most people wouldn’t immediately think about tax collection as a humanitarian effort. But that’s exactly how Courtney Kay-Decker, Executive Director of the Iowa Department of Revenue sees
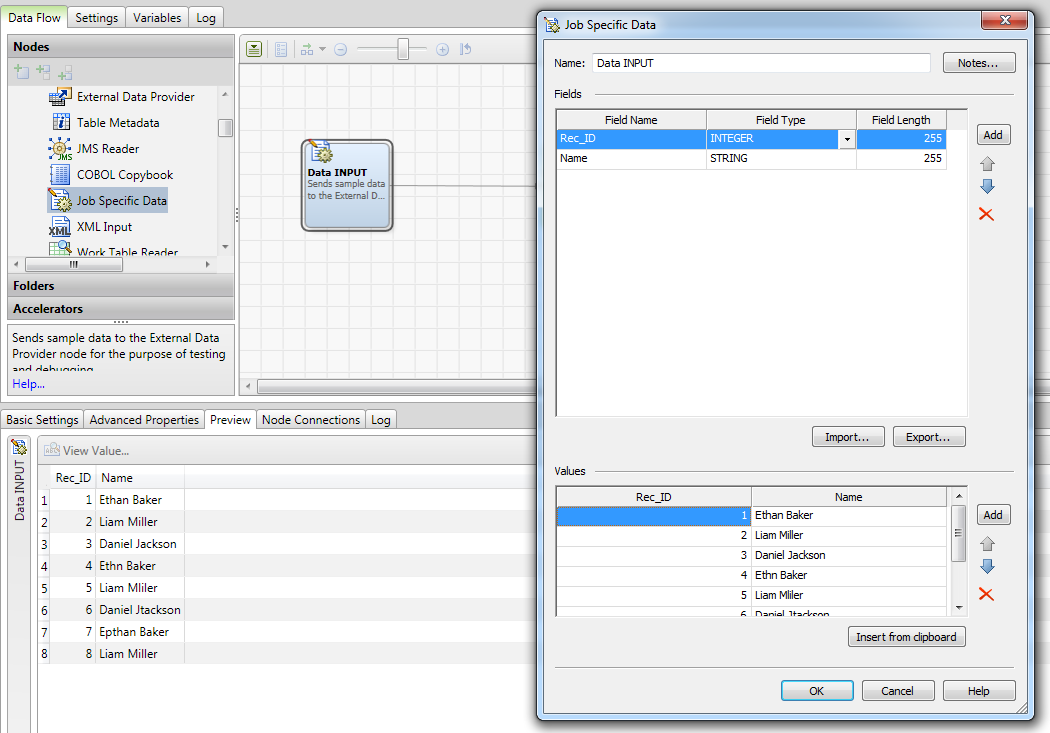

We all have challenges in getting an accurate and consistent view of our customers across multiple applications or sources of customer information. Suggestion-based matching is a technique found in SAS Data Quality to improve matching results for data that has arbitrary typos and incorrect spellings in it. The suggestion-based concept