All Posts
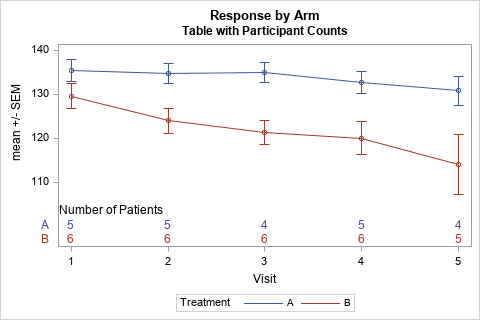

It is always great to read an old paper or blog post and think, "This task is so much easier in SAS 9.4!" I had that thought recently when I stumbled on a 2007 paper by Wei Cheng titled "Graphical Representation of Mean Measurement over Time." A substantial portion of
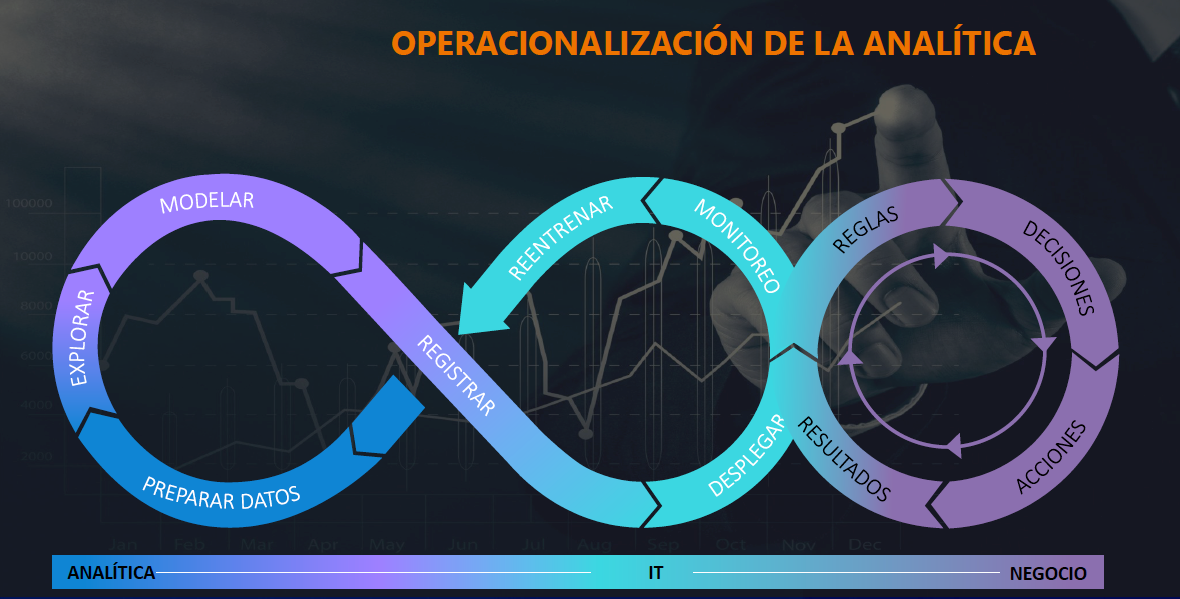

El éxito en el desarrollo e implementación de las iniciativas analíticas empresariales requiere que se tengan propósitos claros, una alineación con los objetivos del negocio, una adecuada captura y calidad de datos, una gestión y mejoramiento continuo de los modelos analíticos desarrollados y no menos importante, la operacionalización o puesta


Many people are often confused on how to file for separation in North Carolina. Every state has different laws related to separation. This article is intended to make the process of legal separation easier to understand for NC residents. A couple becomes legally separated on the date that a husband and wife move into separate residences


At the #AISummit early this summer, I was interested to see that one of the most popular demos on the SAS stand was of object detection. A camera was detecting the nature of an object waved in front of it and tracking it moving through the livestream. This was a


¿Se puede utilizar un programa de análisis para todos los tipos de lenguajes de programación y todos los niveles de usuarios? ¿Cómo se puede garantizar la coherencia entre sus modelos y acciones resultantes? Con las tecnologías analíticas actuales, la conversación sobre analítica abierta y analítica comercial ya no es una


Fraud detection is a wide field. Every organisation experiences the implementation differently.
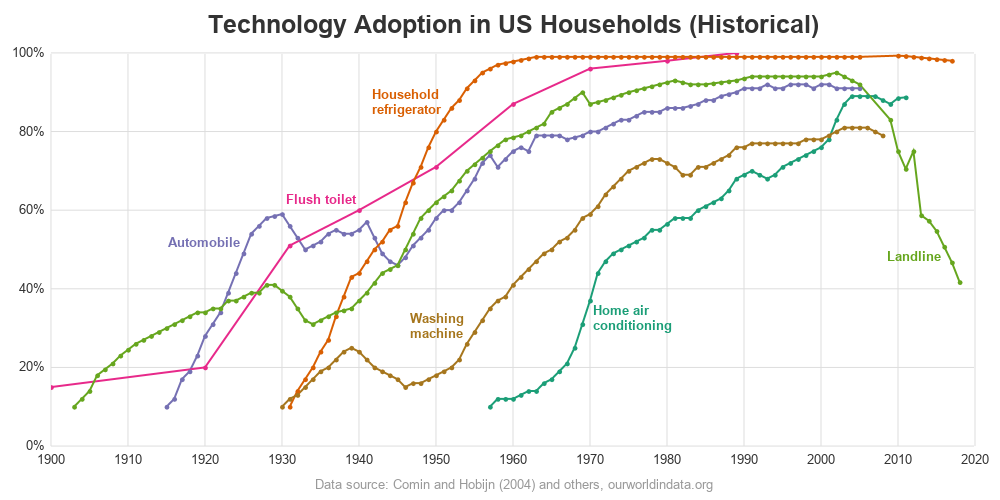

We've had record high 90+ degree temperatures here in the southeast US this past week (September / October), and it has made me appreciate having an air conditioner. Indeed, air conditioners were pretty much invented here in North Carolina (see Eric Cramer). They are used in pretty much every building


Nowadays, geeks are increasingly cool, and we’re all proud to let our inner geek out in public. This wasn't always so ...
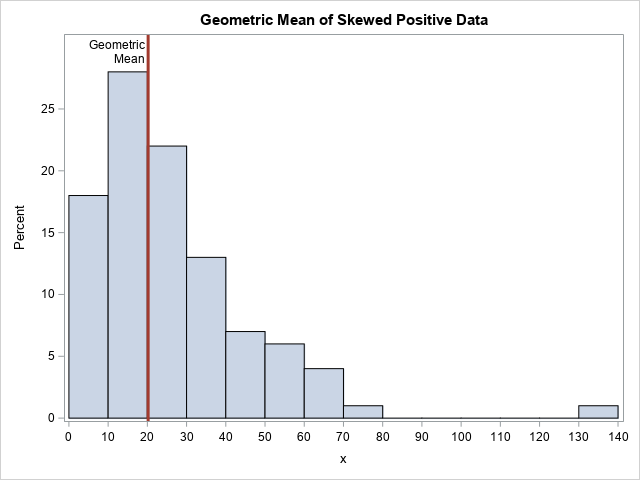
I frequently see questions on SAS discussion forums about how to compute the geometric mean and related quantities in SAS. Unfortunately, the answers to these questions are sometimes confusing or even wrong. In addition, some published papers and web sites that claim to show how to calculate the geometric mean


We’re all familiar with Plato and his quotes so I’d like to share one – For the part can never be well unless the whole is well. The body, mind and spirit are intertwined like a rope. They all work together to provide strength and flexibility. In this case… optimal


Surprise! The data team does more than you think to implement certain legislative actions.


I get it. You are between a rock and a hard place. On one hand, you want to allow space to let your emerging adult take the reins and handle the college application process. On the other hand, you quake in your boots thinking about the [remote] possibility that your high


Cada vez más organizaciones se están moviendo a la nube, pero hay cierta información delicada que quiere mantenerse bajo una capa adicional de seguridad. Con la implementación de soluciones de software y servicios administrados de forma remota (RMSS), aún es posible experimentar los beneficios de la nube, sin que las


Did you know the first SAS® Users Group event took place before SAS was incorporated as a company? In 1976, hundreds of early SAS users gathered in sunny Kissimmee, FL to share tips and offer feedback before SAS was even officially a company. Our users have continued to influence the
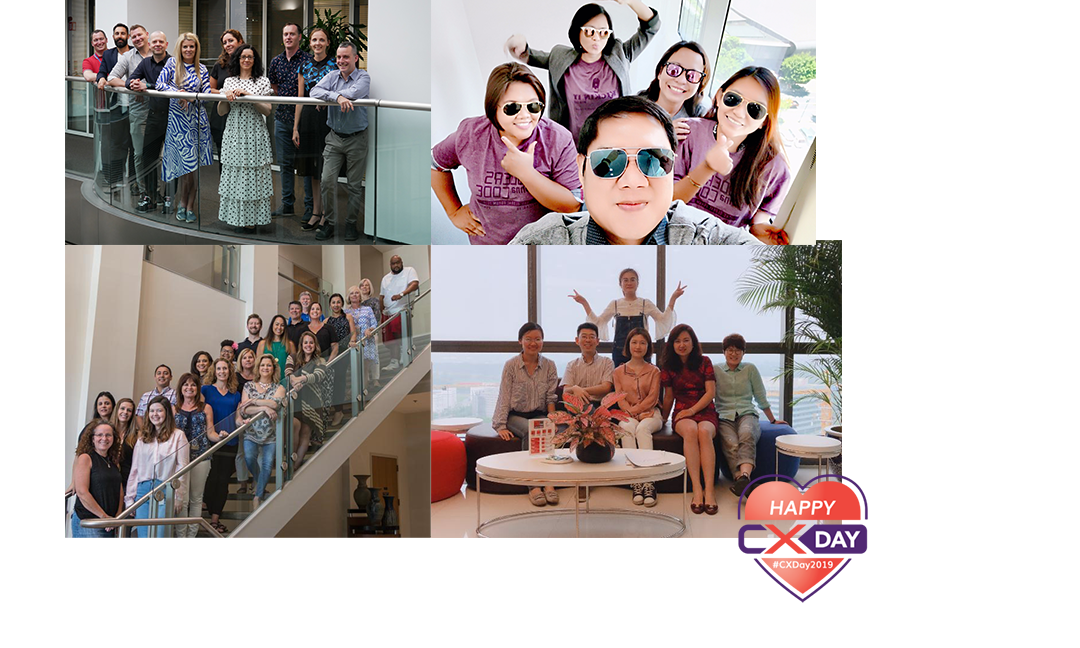

Customer Experience Day (aka #CXDay2019) is one of our favorite days of the year—when we can reflect on customer interactions, questions and feedback from the past year—and look to the year ahead for ways to enhance our customers’ experience, like expanding our support options and helping drive improvements to our website and self-service offerings.