All Posts


En SAS somos testigos de que el empoderamiento de las mujeres ha permitido abrir nuevos caminos en el mundo empresarial. Lo evidenciamos día a día con cientos de ejemplos provenientes de nuestros clientes, en mujeres que nos contactan cada vez con más frecuencia interesadas en aprender de analítica o de


Digital channels open the door to synthetic identity fraud. Luckily, artificial (AI, that is) can defeat synthetic.


Most introductory statistics courses introduce the bar chart as a way to visualize the frequency (counts) for a categorical variable. A vertical bar chart places the categories along the horizontal (X) axis and shows the counts (or percentages) on the vertical (Y) axis. The vertical bar chart is a precursor


この記事はSAS Institute Japanが翻訳および編集したもので、もともとはMike Gillilandによって執筆されました。オリジナルはこちらです(英語)。 またこれは、ゲストブロガーのジェシカ・カーティス(Jessica Curtis)とアンドレア・ムーア(Andrea Moore)による3部構成記事の第3部です(未読の方はこちら:第1部、第2部)。 SASがそれを実現する方法 オープンソースの時系列予測モデルをSAS Visual Forecastingに統合する方法には2つのメインステップがあり、どちらのステップもオープンソース・モデルのメリットと利用価値を増大させます。 基礎:オープンソース予測モデルをプログラム的実行で拡張する 資産の共有:オープンソース予測モデルをカスタム・モデリング・ノードとして利用する ステップ1 - 基礎:オープンソース予測モデルをプログラム的実行で拡張する オープンソースの時系列予測モデルをSASに統合するための基礎は、コードベースのアプローチを通じてプロセスを(手作業ではなく)プログラム的に実行することです。あなたは既にTSMODELプロシジャとEXTLANGパッケージのパワーについてお読みです。 TSMODELプロシジャ内部には、オープンソース・モデルを実行するためのオプションがいくつもあります。まず、自社/自組織のオープンソース戦略を加速および業務運用化するためのインフラとしてSASを活用し、オープンソース・モデルだけを実行することができます。また、これをもう一歩進め、オープンソース・モデルをSASのモデルと一緒に実行することができます。この場合、SASは時系列レベルでSASとオープンソースにまたがって最適なモデルを自動的に選択します。さらに、SASおよびオープンソースのモデルを組み合わせることも可能であり、この場合は、SASとオープンソースの組み合わせが個々の時系列に最適かどうかをSASが判断することになります。このアプローチにより、オープンソース・モデルの構築に投じてきた全ての努力を活かしながら、SASのアルゴリズム群も追加で取り込むことで、両方の世界の “いいとこ取り” を実現できるようになります。どのモデリング手法が最適かをあなたが事前に知る必要はなく、SASがあなたのためにその力仕事を代行します。SASは個々の時系列に関して、オープンソースとSASのどちらのモデルを選ぶべきか、あるいは両方を組み合わせるべきかを判断します。選択の機会が無限にある取り組みにおいて、これでその選択機会が一つ減ったことになります(お分かりですよね? あなたの時間は既に節約されつつあります!)。 図2は、TSMODELプロシジャとEXTLANGパッケージの実際の様子を示しています。これは、R言語のauto.arima関数をSASで実行している例です。EXTLANGパッケージを使うと、オープンソース・コードを読み込む方法の柔軟性が高まります。SASの内部で(図2のように)明示的にオープンソース・コードを記述することも、あるいは、指定したファイルからオープンソース・コードを読み込むこともできます。 この基礎のステップにより、オープンソースおよびSASの時系列予測モデルがともにプログラム的に実行されるようになります。予測結果は、幅広いビジネスユーザー層による利用のために、川下側の計画システムや実行システムへと簡単な方法で供給することができます。また、この基礎となるプログラム的アプローチを土台として、追加のメリットを得ることも可能です。具体的には「SAS Visual Forecastingのユーザー・インターフェイスの内部で、TSMODELのコードを取り出し、それをカスタム・モデリング・ノードの中へラッピングする」という方法を使います。 ステップ2 - 資産の共有:オープンソース予測モデルをカスタム・モデリング・ノードとして利用する SAS Visual Forecasting のグラフィカルなユーザ・インターフェースは「様々なカスタムノードを作成し、それらをモデル・パイプライン内での利用のためにExchangeにロードできる機能」により、コラボレーションを強化します。カスタムノードはEXTLANGの機能を活用して、あらゆるR/Python予測モデルを実行することができます。様々な技法を使いたい場合には、多数のカスタムノードを作成することができます。その手間をかける見返りは多重的です。これらのノードは、どのような時系列予測プロジェクトにも適用可能であり、また、コラボレーションを強化するためにチーム内で共有することも可能です。いったん作成すれば、様々なパイプラインの中で、あるいは様々なデータ入力に対しても再利用することができます。図3をご覧ください。 作成したカスタム・モデリング・ノードは、あらゆるパイプラインに追加することができ、パイプライン内でSASの予測技法と独自のオープンソース・ノード(群)を組み合わせたり競わせたりすることができます。あなたのパイプラインが「複数のオープンソース/SASアルゴリズムによるトーナメント」を実行すると、SASはあなたの仕様指定にベストフィットするモデルを特定するための評価を実行します。モデル比較ノードを使うと、「複数のオープンソース/SAS技法を管理しながら、最良のモデリング戦略を評価するためにそれらを比較する作業」のための、迅速で透明性の高い方法が実現します。図4をご覧ください。 SAS Visual Forecasting のグラフィカルなユーザ・インターフェースを使うことで、「ワークロードの分散処理」や「オープンソースとSASにまたがるモデル選択」など、プログラム的アプローチの全ての利用価値が手に入ります。しかし、それだけではありません。このアプローチには「生産性と透明性の向上」、「オーバーライド(手動調整)機能や例外管理機能も備えた、ガバナンスの効いたワークフロー」、「ビジュアライゼーション機能との統合」という追加のメリットもあります。これらのビジュアライゼーション機能はUIに組み込まれており、ユーザーは追加の労力なしで、時系列予測モデルをより的確に理解および評価できるようになります。その使い勝手は対話操作性と協働作業性に優れており、プログラマー以外の幅広いユーザー層が利用できます。 プログラム的アプローチを利用するか、Visual Forecasting のグラフィカルなユーザ・インターフェースの中でカスタム・モデリング・ノードを作成するかを問わず、SASは小規模なプロジェクトから全社規模のソリューションへの転換を図る取り組みに適した、拡張性と弾力性の高い時系列予測環境を実現します。 まとめ 要約すると、SAS Visual Forecastingはオープンソースによる時系列予測戦略の可能性を広げます。TSMODELはSAS Visual Forecastingの基底をなしているプロシジャであり、EXTLANGパッケージはオープンソース言語との統合を可能にします。TSMODELとEXTLANGの組み合わせによって “マジック” が生まれます。SASはオープンソース・スクリプトを分散処理します。SASは複数の入力データを同時並行で読み込みます。SASはオープンソース・コードの実行を分散処理します。SASは複数の出力データセットを同時並行で書き出します。分散処理、拡張性、弾力性 ── 要チェックです!
この記事はSAS Institute Japanが翻訳および編集したもので、もともとはMike Gillilandによって執筆されました。オリジナルはこちらです(英語)。 またこれは、ゲストブロガーのジェシカ・カーティス(Jessica Curtis)とアンドレア・ムーア(Andrea Moore)による3部構成記事の第2部です(第1部はこちら)。 SASがオープンソースにもたらす価値 何よりもまず、SASは時系列予測用の入力データを分散処理します。SASは時系列予測のためにデータをインテリジェントに分割する方法を理解しており、例えば、時系列グループが様々なワーカーノードにまたがって分割されることはありません。その上で、SASはオープンソースのスクリプト群そのものを複数のワーカーノードにまたがって分散させ、オープンソース・コードの実行を分散処理します。より具体的に言うと、EXTLANGパッケージはPythonまたはRのコードを呼び出す際、個々のPython/Rインタプリタを複数のワーカーノードのそれぞれに振り向けます。その結果、複数の時系列は同時並行で処理されます。このことがスケーラビリティと効率性の観点から何を意味するかを考えてみてください。これにより、あなたは自社/自組織の時系列予測能力を「一つの時系列予測課題の解決」から「組織全体の多種多様な時系列予測課題の解決」へと広げることができるようになります。しかも、より迅速かつ大規模に解決することができます。 例えば、あなたの勤務先がグローバル小売企業だと想像してみてください。あなたのビジョンは、単一の一貫した時系列予測プラットフォームで会社全体の多種多様な時系列予測課題を解決することです。膨大な数のSKUの品揃えの需要予測から、サプライチェーン全体に展開すべき適切な在庫量の判断、各店舗における労働の最適化に至るまで、あらゆる取り組みにおけるあなたの目標は、アナリティクスに基づく正確な意思決定を推進することです。今日、あなたはちょうど、「財務計画の意思決定のための集計レベルの時系列予測」をR言語で開発するプロジェクトで、最初の作業パスを終えたところだとしましょう。R言語による時系列予測アプローチは多くの点で成功しているように見えますが、あなたは店舗の労働に関する意思決定をサポートするために、これらの時系列予測機能を拡張し、より高粒度なレベルでの時系列予測を開発することを目指しています。時系列予測担当アナリストのチームは小規模であるため、あなたには、多種多様な時系列予測ユースケースに対応するために効率的に処理規模を拡大・拡張できる自動化されたプロセスが必要不可欠です。 集計レベルでの財務計画のために、あなたは1,000個の時系列処理を実行しています。店舗別および部門別の店舗労働計画の場合、この数はあっという間に10万個へと膨れ上がります。SKU/店舗レベルのサプライチェーン計画では、時系列は数百万個に及びます。これは間違いなく、大規模な時系列予測課題だと思われます。「分散処理に対応したスケーラブルな時系列予測ソリューションのパワーによってのみ克服可能な課題」ということです。ようこそ、SAS Visual Forecasting の領域へ。 どのような大規模な時系列予測課題でも、成功のカギを握るのは自動化です。そしてそれこそ、SASが行うことです。SASは統計的予測プロセスおよびオープンソース・モデルの実行を自動化することにより、お客様のビジネスにおける時系列予測プロセスの効率化を推進します。TSMODELプロシジャとEXTLANGパッケージのパワーにより、SASはオープンソース・モデルの実行時間を加速することで、時系列予測プロセスの効率化を更に推進します。これにより、あなたのチームは「時系列予測モデルを一度に一つずつ作成する負担」が軽減し、真の例外ベースのプロセスへと移行することができます。解放された時間で、事業計画の取り組みや、予測対象を新しい領域に広げる取り組みに注力できるようになります。端的に言うと、少ないリソースで多くのことが行えるようになる、ということです。 いったんモデルを作成した後は、SASが自動的に複数の出力用データセットを生成します。これは単なる時系列予測を超えた機能です。これには「モデルの仕様」、「当てはめ統計量」、「パラメータ推定値」を格納している多種多様なデータセットも含まれています。次に、これらの出力用データセットは ── あなたのご想像通り ── 分散処理にかけられます。このリッチな出力用データはデータサイエンス・チームとビジネス・チームの両方に対し、「重要な需要推進要因」や「モデルの詳細」に関する多くの洞察をもたらします。統計的予測を信用していないビジネス部門の人々と交わしたことのある様々な議論を思い出してください。その点、SASが自動的に作成する出力用データセットは「モデルがなぜ、何を行うのか」を “見える化” するために役立ち、その結果としてビジネス部門側との議論の質が高まり、モデルの採用率が改善されます。 また、SAS Visual Forecasting は、内蔵されているベストプラクティスにより、オープンソース・モデル群の強化も行います。特許取得済みのデータ診断機能やモデル構築プロセスから、リコンサイル(調整)機能付きの自動階層型予測機能、さらには、統合型の時系列セグメンテーション機能に至るまで、SAS Visual Forecastingは単なるアルゴリズムを超えたレベルで、様々なベストプラクティスに基づくエンドツーエンドの時系列予測プロセスを提供します。 自動化機能、加速機能、強化機能は全て、お客様の組織のニーズに合わせた規模調整に対応可能です。組織全体の多種多様な時系列予測ユースケースに応じて処理規模を拡大(または縮小)することができます。製品階層やロケーション階層の最下位レベルの粒度まで掘り下げる大量かつ複雑な処理にも対応できる高度なスケーラビリティにより、任意のレベルで時系列予測を実行し、結果を生成することができます。「最初に上位レベルの時系列予測を作成/調整し、それを手作業で下位レベルに落とし込む(按分する)手法」に頼る必要はもうありません。SASは、ビジネス上の意思決定が行われるのと同じレベルで、高品質な時系列予測を自動的に生成します。 (第3部に続く)
この記事はSAS Institute Japanが翻訳および編集したもので、もともとはMike Gillilandによって執筆されました。オリジナルはこちらです(英語)。 ゲストブロガーのジェシカ・カーティス(Jessica Curtis)とアンドレア・ムーア(Andrea Moore)による3部構成記事の第1部にようこそ。 時系列予測はユビキタスな存在 時系列予測は、事実上あらゆる業種にわたり、ビジネスにおける多種多様な意思決定の中核を支えています。それはあなたの勤務先が、「膨大なSKUの品揃えの計画」や「配送センターや店舗の労働計画の改善」に取り組む小売企業であるか、需要計画プロセスの刷新に取り組んでいる消費財企業であるかを問いません。あるいは、デジタル広告/在庫計画/価格設定のために時系列予測を活用しているメディア企業や、最適なリソース配分のためにネットワーク利用率を予測している通信企業など、挙げればきりがありません。より優れた予測を得ることのインパクトは、あらゆる企業・組織における “ビジネス上の意思決定” に広範囲かつ抜本的な向上効果をもたらします。 44年以上にわたり、SASは世界各地の数千社の企業のために大規模な時系列予測プロセスを改善し続けています。SASはその間、統計的予測の精度向上と時系列予測作成プロセスの効率化を通じて最終利益の押し上げに貢献する強固な時系列予測ソフトウェアを開発および強化し続けてきました。これは決して大げさな表現ではありません。実際、当社は何冊も書籍を出しています。 SASの最新の時系列予測テクノロジーを搭載したSAS Visual Forecasting は、全社規模の様々な時系列予測課題を迅速かつ自動的に解決するための唯一無二の機能を提供します。SAS Visual Forecastingは、最新鋭の各種アルゴリズム ── 機械学習、時系列、アンサンブル ── だけでなく、過去データの診断、複雑な階層にまたがる自動予測、予測の例外管理に関する内蔵型ベストプラクティスも搭載しています。SAS Visual Forecastingの中核にある信条の一つは、「オープンソースのモデルを実行し、それらを大規模にデプロイ(業務実装)するための、オープン・エコシステムを提供する」ということです。 現在、オープンソース・ソフトウェア(OSS)は時系列予測モデルを開発するために広く使われています。多くの企業・組織がオープンソース戦略に取り組み始めており、PythonやRを活用して時系列予測を作成していますが、組織全体の多種多様な時系列予測ユースケースに対応するべく規模を拡張しようとしたときに様々な難題に直面しています。オープンソースの時系列予測モデルを「SASのソリューション」(以下、単に「SAS」)で実行することには複数のメリットがあり、既存のオープンソース戦略に立脚しながら俊敏かつ効率的な方法を確立することができます。もはや、SASとオープンソースのいずれかを選択する必要はなく、両者は真の相補的な関係にあります。 オープンソースで開始する 多くの企業・組織は、頑健な時系列予測を作成することに苦戦しているほか、様々な時系列予測ユースケースのために規模を拡張しようとしたときに難題に直面しています。個々の時系列予測課題には、データが徐々に増加し、複雑性も増大していくという問題が伴います。 例えば、あなたの勤務先が通信企業で、あなたは追加のインフラ(例:携帯電話網のセル)投資を行うべき場所に関する意思決定をガイドするために、データ帯域幅の需要を予測する必要があるとします。新規インフラ投資を計画するためには、帯域幅需要が時の経過とともにどのように変化するかを理解する必要があります。そこであなたは、市場における総需要が徐々に増加する様子を推計するために、オープンソースの時系列予測ソリューションを構築します。そこから得られる予測は、ネットワークをどれほど拡大するべきかに関する年間計画の基礎となります。そしてあなたは、計画プロセスへのアナリティクス活用について高く評価されたとしましょう。次のサイクルでは、計画のための単独の総合的な予測ではなく、「追加データの取り込みを伴う分析」と「通信インフラの個々の構成要素に関する予測の作成」を依頼されることになりました。 図1は今回の要請が「市場だけでなく、個々の都市/中継局/ノード/構内も対象とした予測」であることを示しています。この分析には、大量のデータと多数の時系列を用いて数千あるいは数百万もの時系列予測を生成する作業に対応できる処理規模の拡張性が必要不可欠です。上位レベルの値を下位レベルの値へと配分するのではなく、高粒度レベルの個々のネットワーク・コンポーネントに関する統計的予測を集計していくことが、予測精度の向上へとつながるからです。こうした予測精度の向上が実現すれば、資本計画プロセスは更に洗練されたものとなり、リソースは最も必要性の高い場所にピンポイントで、適切なタイミングで配分されるようになります。 これはネットワーク計画に固有の話ではなく、同じテーマの議論が全ての業種で繰り返されています。ここで必要とされているのはパラダイム・シフトです。あなたはもはや、個々の時系列予測を手作業でチューニングすることはできません。数量が大きすぎるからです。 必要なのは、「あらゆるタイプのユーザー(例:プログラマーと非プログラマー)が “モデルの構築” や “高品質な時系列予測の生成” において生産的になること」および「分散環境でデータを高速に処理すること」を可能にするソリューションです。そうしたソリューションでは様々なプロセスの自動化が、高精度な時系列予測の生成を促進します。 ここまで来ると、予測モデルを構築するだけの話ではなくなります。それよりも遥かに大規模な取り組みになります。また、時系列予測の結果を事業計画プロセスに統合することも必要になります。そのためには、多くのユーザーが結果を確認・操作したり、必要に応じて処理を追加したりできるようなソリューションが必要です。また、結果を共有できる機能や、ビジネスユーザーが業務プロセスの中で結果を利用できる機能も重要です。 多くの企業が難題に直面している理由は、これまでの努力を無駄にしたくないと考えたり、継続性を懸念したりしている一方で、自社の現在のオープンソース・アプローチが既に限界に達していると気付いているからです。 SASのソリューションはオープンソースを強化・拡張する 全社的/全組織的な時系列予測の取り組みにおいてオープンソース・アプローチが限界に達したとしたら、それこそSASが本領を発揮する状況です。オープンソースの時系列予測モデルを構築するために投じてきた膨大な作業の全てを失いたくないと思うのは当然のことです。実際問題、それらを失う必要はありません。SASのアプローチでは、オープンソースのモデル群をSAS Visual Forecastingに取り込んだ上で、それらの利用価値を拡張します。 SAS Visual Forecastingによるオープンソース統合の基礎となっているのは、TSMODELプロシジャとEXTLANGパッケージです。TSMODELは、SAS Visual Forecastingの基底をなしているプロシジャです。EXTLANGパッケージは、外部言語(例:PythonやRなど)のシームレスな統合を可能にします。 TSMODELとEXTLANGは「オープンソースによる時系列予測戦略」を改善します。SASはこれらの技法を通じて、オープンソースのモデルを実行するための「分散処理に対応した拡張性・弾力性の高い方法」を提供します。データの準備から、モデルの開発、モデルのデプロイに至るまで、アナリティクス・ライフサイクルの全てのステップにおいて、SASはオープンソースの時系列予測モデルを強化します。SASはPythonやRで作成されたモデルに対してオープンなだけでなく、分析ワークロードを自動的に分散処理することでオープンソースを拡張します。ちょっと立ち止まって掘り下げましょう。言い換えると、SASが「オープンソースのモデルを改善する」というのは、ひとつには、「その実行を高速化する」ということです。また、それ以外にも、SASが備える数々の “実証済みの利用価値の高い機能性” も手に入ります。もし興味をそそられたのなら、どうぞ読み進めてください。 (第2部に続く)


With unemployment at a three-year high, the socio-economic impact of the COVID-19 pandemic has hit the UK hard. While significant progress has now been made on the clinical side of the crisis, and the success of the vaccination programme is a cause for optimism, the impact on the economy will


Asumir nuevas responsabilidades suele ser un momento muy importante para un líder. Más allá de todo el reconocimiento personal, la expansión de las competencias es también un momento muy intenso y humilde: hay muchos colegas con los que conectar, procesos que ajustar, cosas que aprender. También es un momento muy
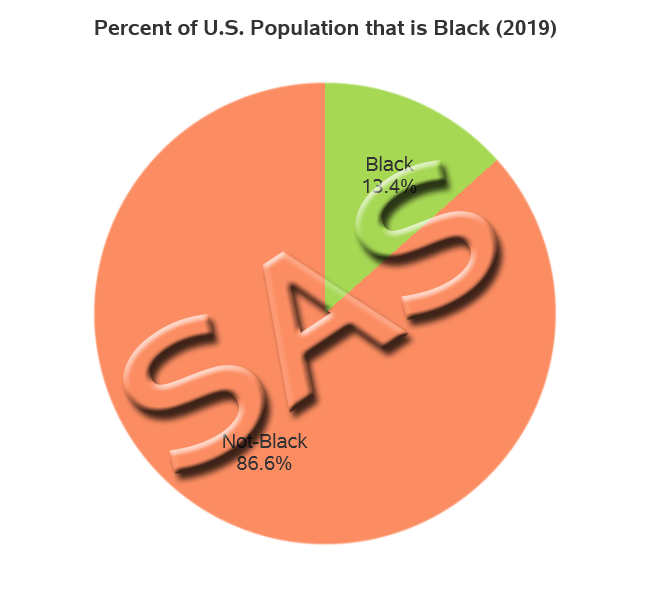

This is another in my series of blog posts where I take a deep dive into converting R graphs into SAS graphs. Today we'll be working on pie charts. I know, I know ... you visualization 'purists' might be wagging your finger at me, and saying "pie charts are no good."
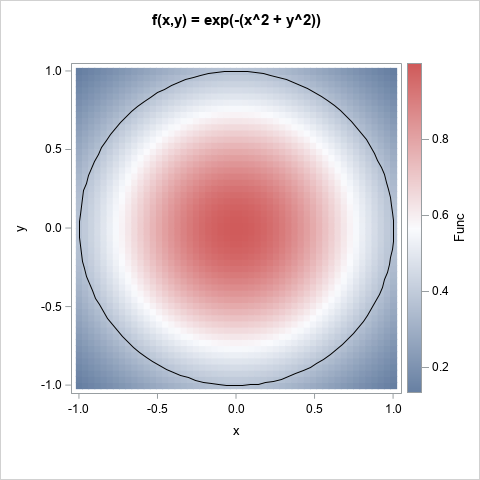
As mentioned in my article about Monte Carlo estimate of (one-dimensional) integrals, one of the advantages of Monte Carlo integration is that you can perform multivariate integrals on complicated regions. This article demonstrates how to use SAS to obtain a Monte Carlo estimate of a double integral over rectangular and


Cada vez más organizaciones de todo tipo son conscientes de la importancia de la toma de decisiones basada en datos. Este es el caso de ICEX España Exportación e Inversiones, entidad pública que promueve la internacionalización de las empresas españolas y la atracción de la inversión extranjera. A través de
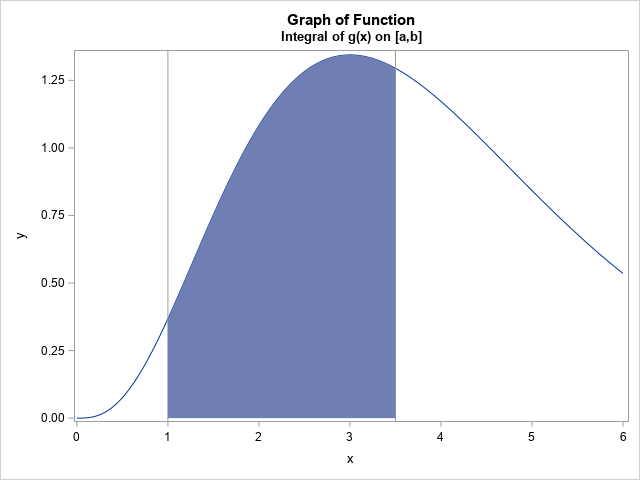
A previous article shows how to use Monte Carlo simulation to estimate a one-dimensional integral on a finite interval. A larger random sample will (on average) result in an estimate that is closer to the true value of the integral than a smaller sample. This article shows how you can
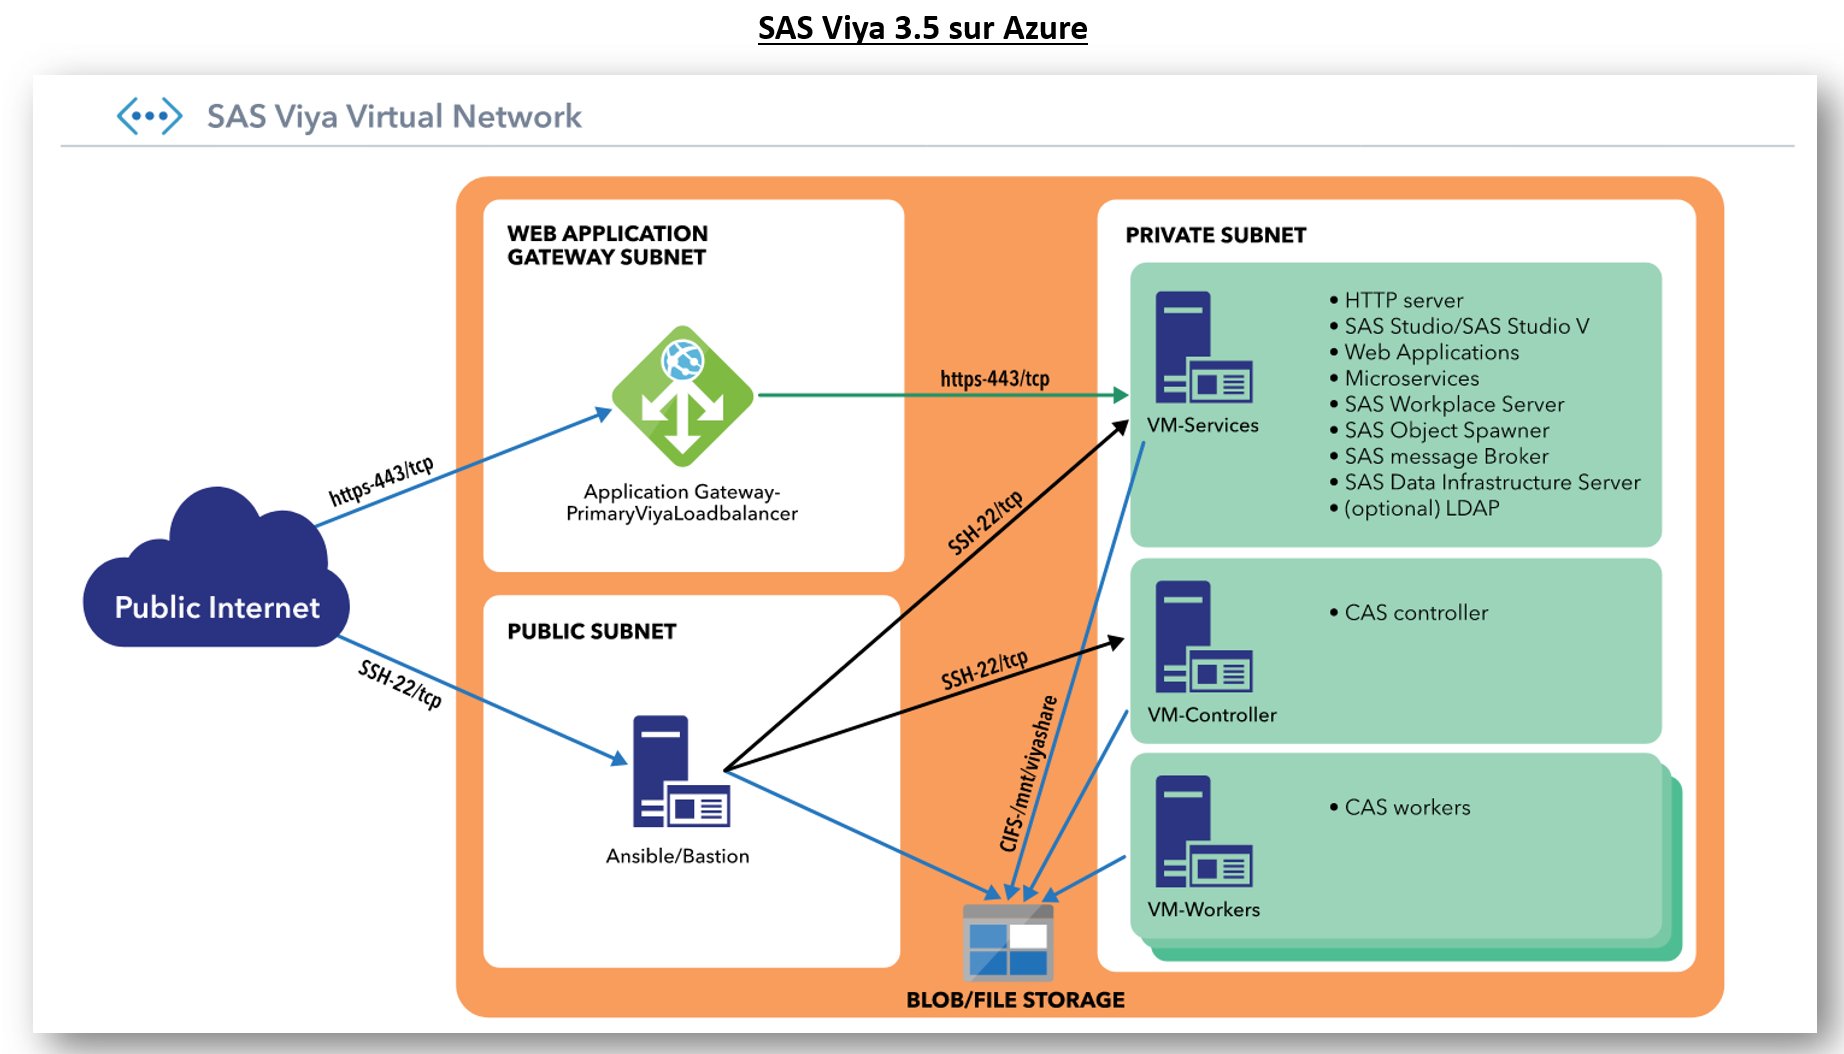

SAS Viya 4 est un terme qui englobe toutes les versions basées sur la cadence (cf. ci-dessous). La plupart des références omettent le chiffre 4 parce qu'elles concernent une version spécifique (comme 2020.1) ou qu'elles sont pour SAS Viya en général. Dans certaines références qui font la distinction entre les


If I were to say that we live in uncertain times, that would probably be an understatement. Therefore, I won’t say that. Oops, I already did. Or did I? For centuries, people around the world have been busy scratching their heads in search of a meaningful answer to Shakespeare’s profoundly


The time for experimenting with artificial intelligence (AI) is over. In a COVID-19 climate, it is important to be able to quickly scale up analytical models to industrial processes. SAS believes the solution can be found in democratizing AI. Most manufacturing businesses have large amounts of data at their disposal.