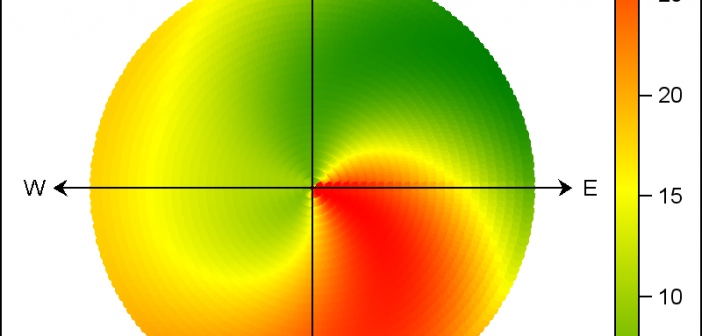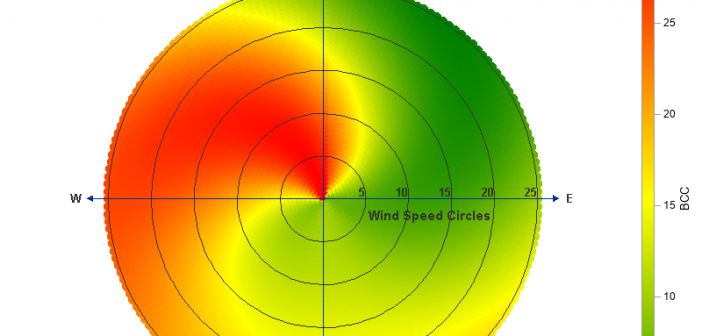
A few years ago Sanjay showed how to create a polar graph by creating a gtl template, and then plotting it using Proc SGRender. These days, Proc SGPlot has all the functionality you need to create this graph, therefore I've rewritten the example to just use SGPlot. And while I
Tag: Vector Plot
I hope everyone has noticed some new shortcuts in Graphically Speaking. As you scroll down and look to the right, there are shortcuts for Sanjay's getting started and clinical graphs posts and one for my advanced blogs. When Sanjay asked me to make an icon for my advanced blogs, at
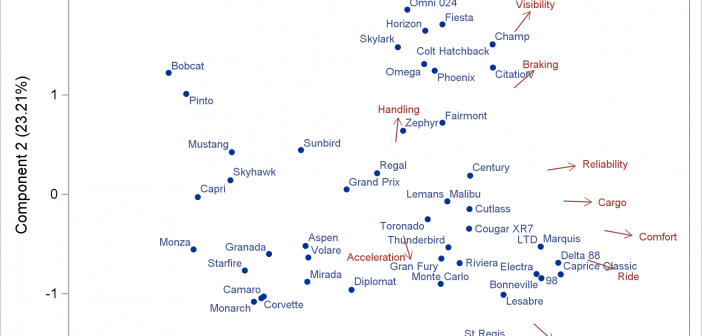
A vector plot draws a line from one point in a graph to another point. In this post, I will show you how to create short vectors instead of vectors that emanate from the origin. I also show how to modify the positions of the vector labels.
There are many situations where it is beneficial to display the data using a polar graph. Often your data may contain directional information. Or, the data may be cyclic in nature, with information over time by weeks, or years. The simple solution is to display the directional or time data
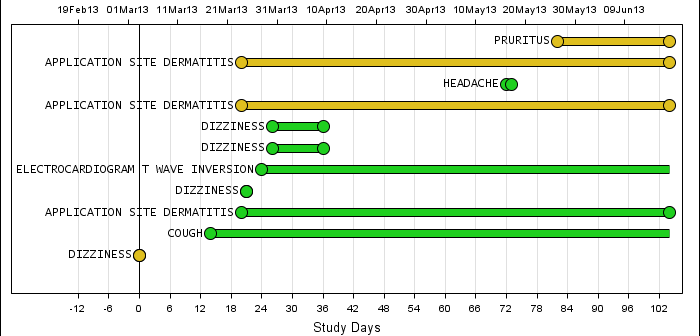
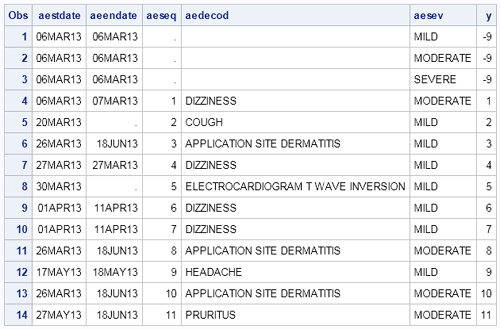
Back in February, I posted an article on creating Adverse Event Timeline Graph. In the SAS 9.2 version (first one), one item that was less than ideal was the way to position the AE names to the left of the event. The AE names are displayed using the scatter plot statement
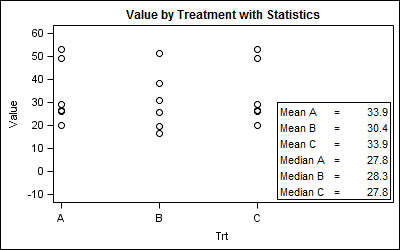
Statistical graphs often include display of derived statistics along with the raw data. Often these statistics are presented in a tabular format inside the graph. With SGPLOT procedure, a table of statistics can be added to the graph as an inset table, as shown below. Using a Stat Table: SGPLOT code:
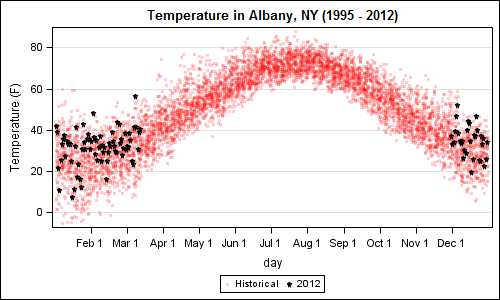
A recent article in the SAS and R blog was about current winter temperatures in Albany, NY. The temperature data for the recent winter (Dec 2011 - Mar 2012) was plotted on a polar graph. Robert Allison posted an article on displaying the same data as a Polar Graph using SAS/GRAPH . Here is his
Here is the second installment of sample graphs from the SG Procedures book - The Adverse Event Timeline. This is a graph commonly used in patient profiles for clinical trials where we track the progress of a patient through a hospitalization event, tracking the dates and severity of the adverse events. The
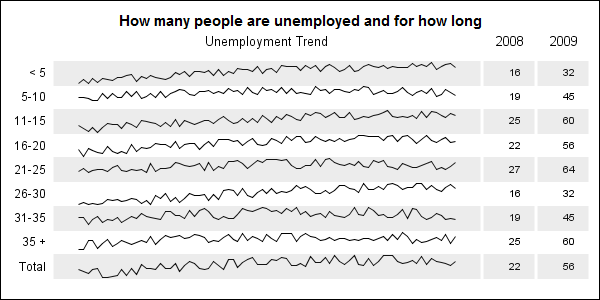
When viewing time series data, often we only want to see the trend in the data over time and we are not so concerned about the actual data values. With multiple time series plots, forecasting software can find clusters to help us view series with similar trends. Recently I saw a graph showing the trend of unemployment