Search Results: sgplot series (144)

Data Visualization
Sanjay Matange 1
Timeseries plots with regimes

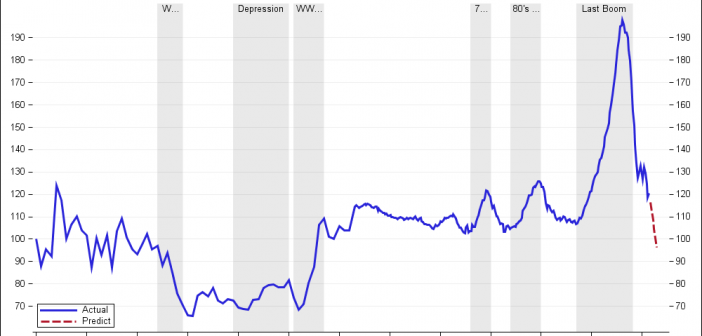
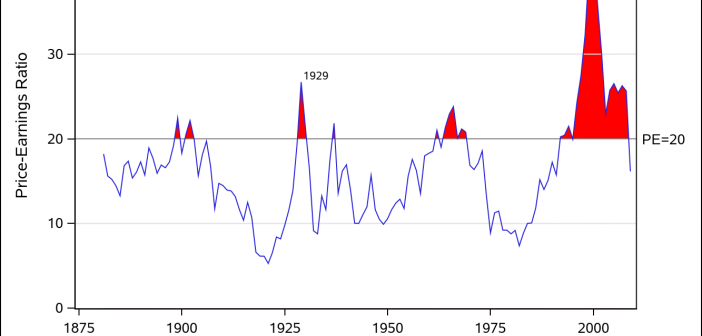
Recently we discussed the features of the Shiller Graph, showing long term housing values in the USA.  To understand the features necesary in the SGPLOT procedure to create such graph easily, it was useful to see how far we can go using GTL as released with SAS 9.2(M3). I got the data Shiller Housing index data

Data Visualization
Sanjay Matange 0
SGPLOT procedure - the basics

In this blog we will discuss many aspects of the SG Procedures.  This article will cover some basic features and workings of the SGPLOT procedure to establish a baseline. The single-cell graph is the work horse for data visualization.  From the simple bar chart to the complex patient profiles for clinical

Data Visualization
Sanjay Matange 0
In good company

A recent post on the SAS website shows the SAS Annual Revenue History.  It would be interesting to see how we could create such a graph using SG procedures, and how we could add more information and interest in the presentation.  So, I started with the basic informaiton on the annual revenues provided,

Data Visualization
Dan Heath 0
The Power of Stacking

Amazing things can be created when you start with small pieces and stack them together. Just ask Bryan Berg. He is the current world record holder for the tallest house of cards. This same principle can be applied to the SGPLOT and SGPANEL procedures. You can take the individual plot

1 2 3 4 5 15