Search Results: panel (76)

Data Visualization
Sanjay Matange 1
Row Lattice Headers

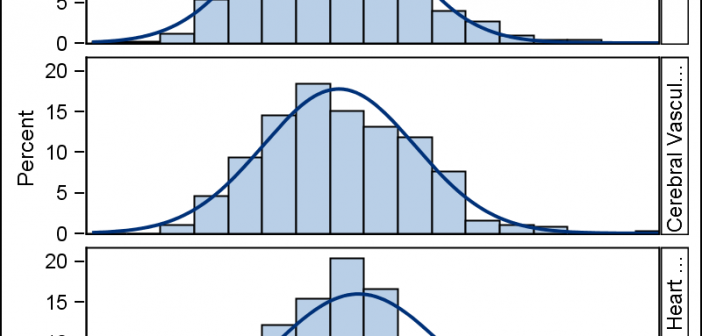
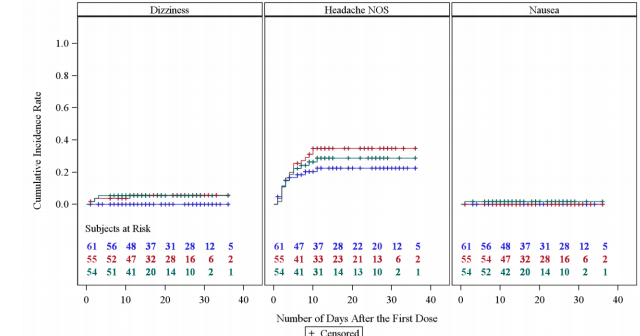
The SGPANEL procedure makes it easy to create graph panels that are classified by one or more classifiers.  The "Panel" layout is the default and it places the classifier values in cell headers at the top of each cell. When using LAYOUT=Latice or RowLattice, the row headers are placed at

Data Visualization
Sanjay Matange 0
Report from SGF 2015

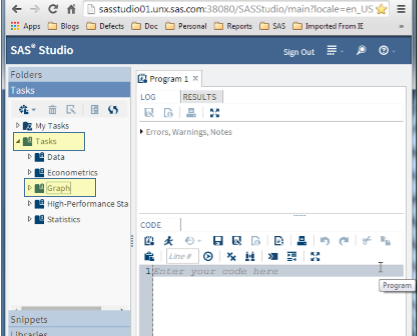
SGF 2015 was a blast with a focus on Visual Analytics, SAS Studio, Hadoop and more.  Graphs were everywhere, and it was a banner year for ODS Graphics with over 15 papers and presentations by users on creating graphs using SG Procedures, GTL and Designer. Dan Heath, Prashant Hebbar, Scott

Data Visualization
Sanjay Matange 4
Likert Graphs

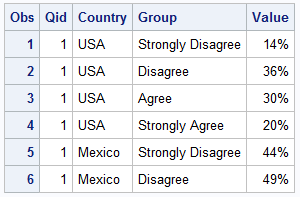
Just this morning I received a request for a brief survey from Apple on my feedback about the new iPhone6+.  Yes, I finally got one, dead last in the family.  The survey followed the usual format, with a number of questions on what I like or dislike about it, with

Data Visualization
Sanjay Matange 8
Report from PharmaSUG 2014

Just getting back from PharmaSUG 2014 in San Diego.  The conference was great, both inside and outside.  The organizers ordered up some great weather for the Padres game and also for dinner on the flight deck of the Midway Carrier. Our focus here being on graphics, we were all extremely gratified by the presentations in

1 3 4 5 6 7 8