Search Results: panel (76)

Data Visualization
Dan Heath 0
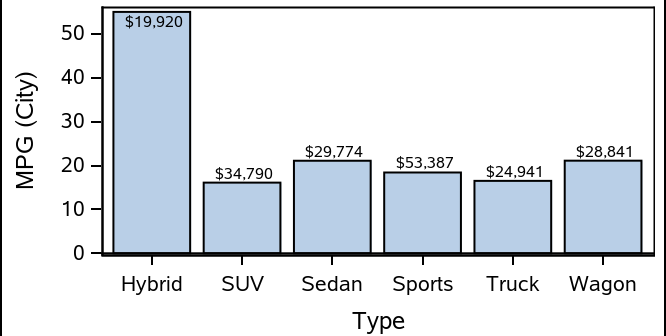
Optimizing bar label placement

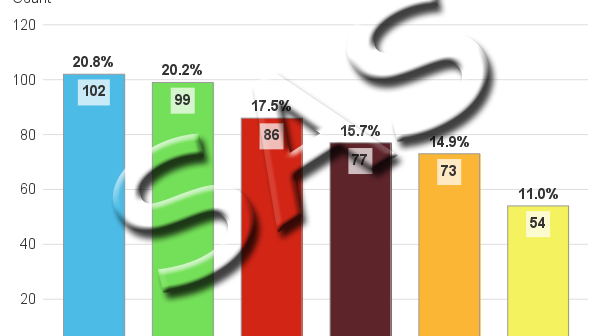
When creating bar charts, it is very common to display labels with the bars to make it easier to determine the bar values or to provide additional information in the chart. However, these labels can take away valuable data space, particularly if you generate a smaller-sized graph. As you see

Data Visualization
Debpriya Sarkar 12
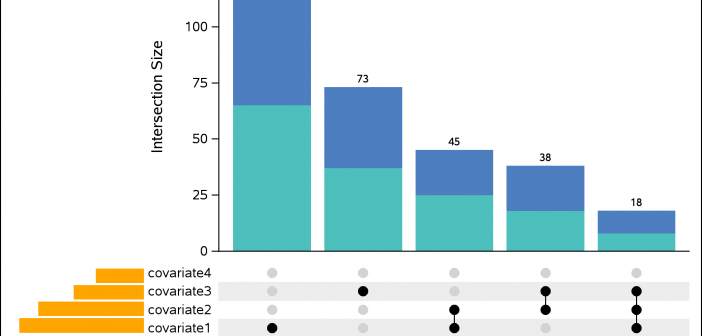
UpSet Plot using GTL

An UpSet plot is used to visualize intersections of sets. In this post, we will illustrate techniques to create this plot using the Graph Template Language (GTL). We assume that you are familiar with GTL. From the point of view of construction, we leverage the LATTICE layout available in GTL

1 2 3 4 8