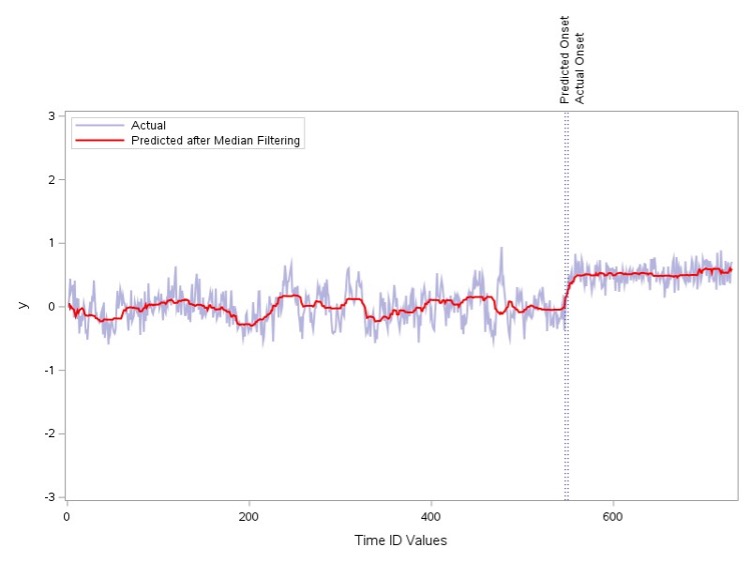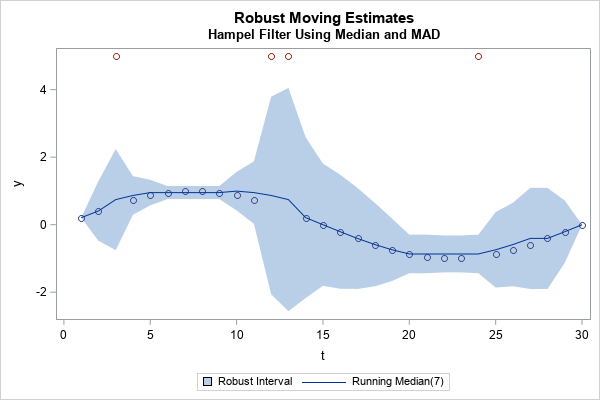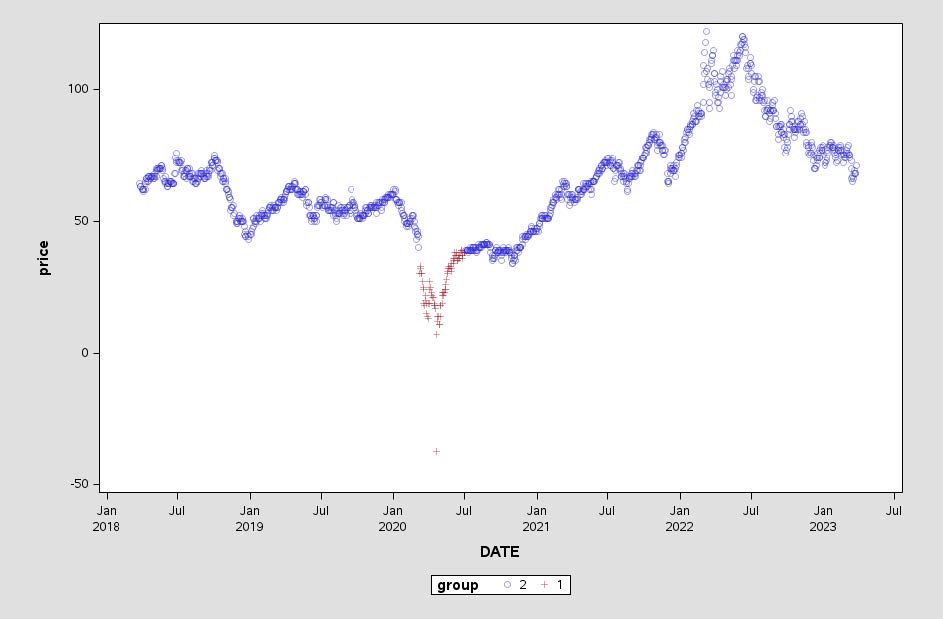
You’ve heard about the smart grid, but what is it that makes the grid smart? I’ve been working on a project with Duke Energy and NC State University doing time-series analysis on data from Phasor Measurement Units (PMUs) that illustrates the intelligence in the grid as well as an interesting
Tag: time series
This post will violate the “what happens in Vegas stays in Vegas” rule, because last week I had the pleasure of attending and participating in the Analytics 2014 event there and want to share some of what I heard for those who couldn’t attend. I was joined by over 1,000
It's easy to plot events that happened at a certain time, but what about events that extended over a range of dates, such as recessions? ... This blog post teaches you a nice trick to use for that! Let's say you have a plot of the labor force participation rate
In light of the recent reports that glaciers in Antarctica are melting, what SAS graphs might be useful in analyzing the data?... When floating sea ice melts (such as at the North Pole), it doesn't raise the sea level - but when ice on land melts (such as glaciers at
Vector languages such as SAS/IML, MATLAB, and R are powerful because they enable you to use high-level matrix operations (matrix multiplication, dot products, etc) rather than loops that perform scalar operations. In general, vectorized programs are more efficient (and therefore run faster) than programs that contain loops. For an example
Wavelet analysis is an exciting and relatively new field of study that enables one to extract underlying patterns either from spatially varying or temporally varying data. Pixel values representing the relative brightness and color that constitute an image are an example of spatially varying data, and daily variations of financial
Finding the maximum value of a function is an important task in statistics. There are three approaches to finding a maxima: When the function is available as an analytic expression, you can use an optimization algorithm to find the maxima. For example, in the SAS/IML language, you can use any
Don’t worry! This is not an excerpt from a romantic love letter. The title of this blog post is an allusion to my talk on "Missing Values", at the A2013 conference in June in London. There is not much time for emotions: dealing with missing values in analysis is not
To a statistician, the DIF function (which was introduced in SAS/IML 9.22) is useful for time series analysis. To a numerical analyst and a statistical programmer, the function has many other uses, including computing finite differences. The DIF function computes the difference between the original vector and a shifted version
To a statistician, the LAG function (which was introduced in SAS/IML 9.22) is useful for time series analysis. To a numerical analyst and a statistical programmer, the function provides a convenient way to compute quantitites that involve adjacent values in any vector. The LAG function is essentially a "shift operator."
Last week I blogged about how to construct a smoother for a time series for the temperature in Albany, NY from 1995 to March, 2012. I smoothed the data by "folding" the time series into a single "year" that contains repeated measurements for each day of the year. Experts in
When viewing time series data, often we only want to see the trend in the data over time and we are not so concerned about the actual data values. With multiple time series plots, forecasting software can find clusters to help us view series with similar trends. Recently I saw a graph showing the trend of unemployment